|
Download Data (XLS File) |
|
||||||||
|
||||||||
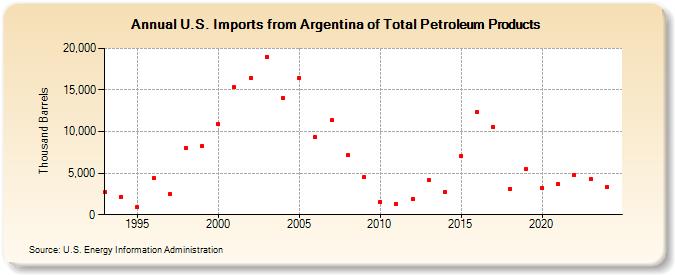
| U.S. Imports from Argentina of Total Petroleum Products (Thousand Barrels) | ||||||||
| Decade | Year-0 | Year-1 | Year-2 | Year-3 | Year-4 | Year-5 | Year-6 | Year-7 | Year-8 | Year-9 |
|---|---|---|---|---|---|---|---|---|---|---|
| 1990's | 2,687 | 2,190 | 873 | 4,440 | 2,472 | 8,056 | 8,237 | |||
| 2000's | 10,903 | 15,300 | 16,413 | 19,015 | 14,037 | 16,457 | 9,315 | 11,354 | 7,135 | 4,479 |
| 2010's | 1,588 | 1,334 | 1,884 | 4,147 | 2,789 | 7,037 | 12,357 | 10,597 | 3,143 | 5,508 |
| 2020's | 3,262 | 3,706 | 4,774 | 4,240 |
| - = No Data Reported; -- = Not Applicable; NA = Not Available; W = Withheld to avoid disclosure of individual company data. |
| Release Date: 6/28/2024 |
| Next Release Date: 8/30/2024 |