|
Download Data (XLS File) |
|
||||||||
|
||||||||
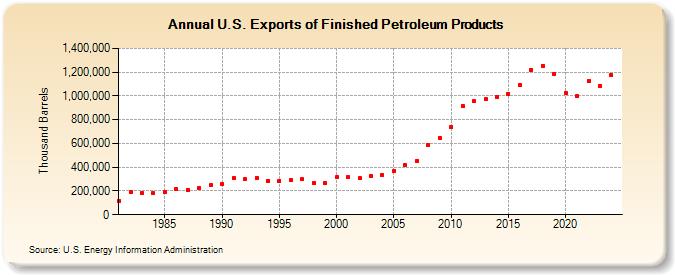
| U.S. Exports of Finished Petroleum Products (Thousand Barrels) | ||||||||
| Decade | Year-0 | Year-1 | Year-2 | Year-3 | Year-4 | Year-5 | Year-6 | Year-7 | Year-8 | Year-9 |
|---|---|---|---|---|---|---|---|---|---|---|
| 1980's | 118,492 | 187,639 | 183,120 | 179,341 | 187,166 | 213,890 | 209,145 | 223,122 | 246,903 | |
| 1990's | 257,994 | 307,655 | 296,908 | 311,320 | 287,756 | 285,570 | 291,358 | 296,804 | 267,768 | 266,232 |
| 2000's | 315,953 | 317,020 | 307,373 | 327,407 | 334,228 | 368,513 | 417,686 | 455,240 | 588,500 | 648,512 |
| 2010's | 739,130 | 913,741 | 954,858 | 970,997 | 991,766 | 1,019,443 | 1,087,683 | 1,220,551 | 1,255,352 | 1,187,120 |
| 2020's | 1,025,586 | 996,699 | 1,126,741 | 1,083,312 |
| - = No Data Reported; -- = Not Applicable; NA = Not Available; W = Withheld to avoid disclosure of individual company data. |
| Release Date: 3/29/2024 |
| Next Release Date: 8/30/2024 |