|
Download Data (XLS File) |
|
||||||||
|
||||||||
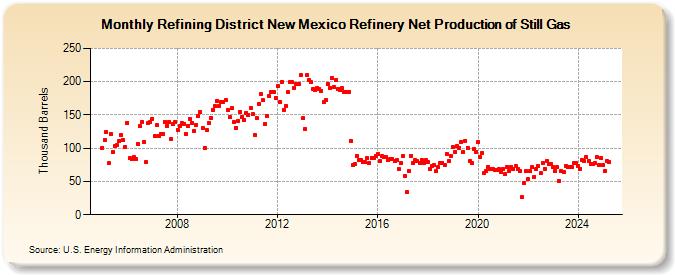
| Refining District New Mexico Refinery Net Production of Still Gas (Thousand Barrels) | ||||||||
| Year | Jan | Feb | Mar | Apr | May | Jun | Jul | Aug | Sep | Oct | Nov | Dec |
|---|---|---|---|---|---|---|---|---|---|---|---|---|
| 2005 | 101 | 112 | 124 | 77 | 122 | 95 | 103 | 105 | 111 | 120 | 112 | 102 |
| 2006 | 138 | 85 | 83 | 87 | 84 | 107 | 133 | 140 | 110 | 79 | 138 | 139 |
| 2007 | 144 | 118 | 135 | 119 | 122 | 122 | 140 | 134 | 140 | 114 | 136 | 140 |
| 2008 | 128 | 133 | 138 | 137 | 122 | 134 | 144 | 138 | 126 | 135 | 148 | 154 |
| 2009 | 130 | 101 | 127 | 138 | 146 | 158 | 163 | 171 | 164 | 170 | 170 | 173 |
| 2010 | 158 | 147 | 160 | 139 | 131 | 141 | 155 | 147 | 142 | 153 | 150 | 161 |
| 2011 | 151 | 120 | 145 | 167 | 181 | 172 | 136 | 149 | 178 | 185 | 185 | 176 |
| 2012 | 193 | 169 | 200 | 158 | 164 | 184 | 200 | 199 | 191 | 197 | 196 | 210 |
| 2013 | 145 | 129 | 210 | 202 | 199 | 189 | 188 | 191 | 189 | 186 | 169 | 173 |
| 2014 | 197 | 191 | 206 | 192 | 202 | 189 | 187 | 190 | 185 | 185 | 185 | 111 |
| 2015 | 74 | 76 | 89 | 82 | 82 | 79 | 79 | 85 | 78 | 85 | 85 | 88 |
| 2016 | 91 | 80 | 88 | 86 | 86 | 82 | 83 | 84 | 80 | 82 | 69 | 78 |
| 2017 | 88 | 58 | 34 | 66 | 89 | 77 | 82 | 80 | 78 | 82 | 78 | 82 |
| 2018 | 79 | 68 | 73 | 74 | 65 | 71 | 78 | 78 | 75 | 91 | 81 | 88 |
| 2019 | 102 | 95 | 103 | 101 | 110 | 95 | 111 | 101 | 80 | 77 | 99 | 95 |
| 2020 | 109 | 87 | 93 | 63 | 66 | 72 | 68 | 69 | 67 | 67 | 68 | 64 |
| 2021 | 69 | 61 | 72 | 66 | 72 | 68 | 73 | 69 | 65 | 26 | 48 | 65 |
| 2022 | 53 | 65 | 71 | 57 | 69 | 73 | 62 | 78 | 69 | 80 | 76 | 76 |
| 2023 | 71 | 65 | 71 | 50 | 50 | 64 | 73 | 71 | 72 | 71 | 78 | 78 |
| 2024 | 73 | 69 | 82 | 80 | ||||||||
| - = No Data Reported; -- = Not Applicable; NA = Not Available; W = Withheld to avoid disclosure of individual company data. |
| Release Date: 6/28/2024 |
| Next Release Date: 7/31/2024 |
Referring Pages: