|
Download Data (XLS File) |
|
||||||||
|
||||||||
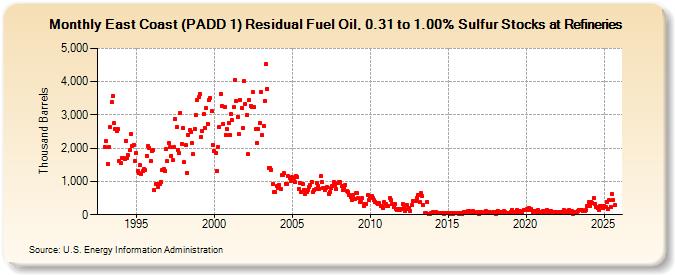
| East Coast (PADD 1) Residual Fuel Oil, 0.31 to 1.00% Sulfur Stocks at Refineries (Thousand Barrels) | ||||||||
| Year | Jan | Feb | Mar | Apr | May | Jun | Jul | Aug | Sep | Oct | Nov | Dec |
|---|---|---|---|---|---|---|---|---|---|---|---|---|
| 1993 | 2,034 | 2,208 | 1,526 | 2,021 | 2,624 | 3,385 | 3,573 | 2,748 | 2,572 | 2,502 | 2,563 | 1,612 |
| 1994 | 1,547 | 1,698 | 1,702 | 1,672 | 2,226 | 1,716 | 1,781 | 1,936 | 2,413 | 2,080 | 2,109 | 1,628 |
| 1995 | 1,850 | 1,307 | 1,246 | 1,485 | 1,236 | 1,302 | 1,371 | 1,346 | 1,775 | 2,064 | 2,010 | 1,610 |
| 1996 | 1,907 | 1,940 | 742 | 918 | 933 | 842 | 923 | 988 | 1,331 | 1,381 | 1,321 | 1,967 |
| 1997 | 1,606 | 2,151 | 2,021 | 1,776 | 1,644 | 2,021 | 2,872 | 2,635 | 1,954 | 1,844 | 3,072 | 2,139 |
| 1998 | 2,605 | 1,575 | 2,094 | 1,264 | 2,409 | 2,545 | 2,476 | 2,163 | 1,812 | 2,575 | 2,992 | 3,459 |
| 1999 | 3,526 | 3,623 | 2,336 | 2,529 | 3,014 | 2,615 | 3,207 | 2,737 | 3,442 | 3,512 | 3,107 | 2,094 |
| 2000 | 1,902 | 1,861 | 1,328 | 2,037 | 2,636 | 3,632 | 3,260 | 2,739 | 3,248 | 2,390 | 2,563 | 2,764 |
| 2001 | 2,407 | 3,025 | 2,849 | 3,224 | 4,054 | 3,408 | 2,949 | 2,424 | 3,458 | 3,215 | 2,615 | 4,008 |
| 2002 | 3,329 | 3,000 | 1,816 | 3,449 | 3,277 | 3,230 | 3,678 | 3,229 | 2,577 | 2,168 | 2,578 | 2,743 |
| 2003 | 3,696 | 2,390 | 2,677 | 3,404 | 4,516 | 3,788 | 1,408 | 1,410 | 1,359 | 914 | 688 | 669 |
| 2004 | 854 | 814 | 902 | 783 | 1,186 | 1,191 | 1,244 | 938 | 910 | 1,150 | 1,116 | 1,016 |
| 2005 | 1,125 | 1,112 | 975 | 1,174 | 1,137 | 786 | 959 | 679 | 910 | 754 | 634 | 697 |
| 2006 | 743 | 835 | 903 | 989 | 668 | 746 | 772 | 946 | 864 | 781 | 1,153 | 979 |
| 2007 | 797 | 753 | 789 | 824 | 634 | 694 | 794 | 872 | 989 | 892 | 771 | 945 |
| 2008 | 969 | 980 | 856 | 742 | 820 | 908 | 719 | 693 | 603 | 523 | 452 | 592 |
| 2009 | 480 | 642 | 651 | 495 | 372 | 384 | 490 | 274 | 332 | 327 | 578 | 457 |
| 2010 | 522 | 562 | 492 | 431 | 395 | 349 | 330 | 343 | 262 | 260 | 191 | 379 |
| 2011 | 322 | 255 | 264 | 507 | 436 | 327 | 217 | 310 | 170 | 156 | 158 | 131 |
| 2012 | 185 | 312 | 204 | 110 | 295 | 164 | 196 | 117 | 283 | 426 | 402 | 409 |
| 2013 | 494 | 604 | 387 | 642 | 550 | 287 | 38 | 49 | 389 | 19 | 30 | 59 |
| 2014 | 72 | 47 | 64 | 84 | 62 | 55 | 63 | 48 | 40 | 35 | 59 | 63 |
| 2015 | 52 | 41 | 30 | 45 | 30 | 48 | 39 | 41 | 35 | 60 | 42 | 28 |
| 2016 | 73 | 47 | 67 | 102 | 105 | 65 | 89 | 110 | 88 | 60 | 58 | 80 |
| 2017 | 28 | 73 | 47 | 53 | 96 | 112 | 79 | 52 | 67 | 40 | 61 | 92 |
| 2018 | 74 | 30 | 123 | 44 | 86 | 78 | 95 | 97 | 72 | 51 | 63 | 43 |
| 2019 | 93 | 154 | 85 | 73 | 60 | 146 | 78 | 114 | 91 | 82 | 146 | 130 |
| 2020 | 132 | 164 | 189 | 154 | 159 | 95 | 105 | 121 | 41 | 127 | 42 | 93 |
| 2021 | 81 | 110 | 82 | 121 | 143 | 67 | 113 | 102 | 59 | 68 | 89 | 90 |
| 2022 | 89 | 70 | 62 | 84 | 49 | 135 | 95 | 87 | 119 | 141 | 41 | 102 |
| 2023 | 29 | 42 | 87 | 73 | 110 | 127 | 127 | 136 | 102 | 112 | 136 | 264 |
| 2024 | 374 | 275 | 394 | 360 | ||||||||
| - = No Data Reported; -- = Not Applicable; NA = Not Available; W = Withheld to avoid disclosure of individual company data. |
| Release Date: 6/28/2024 |
| Next Release Date: 7/31/2024 |