|
Download Data (XLS File) |
|
||||||||
|
||||||||
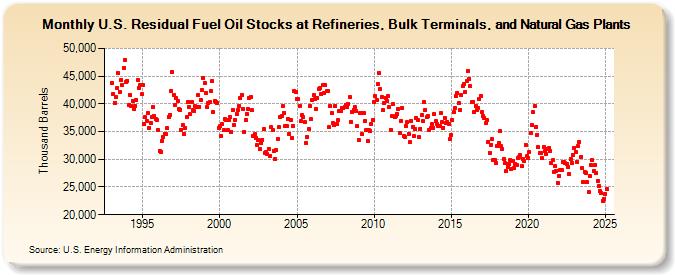
| U.S. Residual Fuel Oil Stocks at Refineries, Bulk Terminals, and Natural Gas Plants (Thousand Barrels) | ||||||||
| Year | Jan | Feb | Mar | Apr | May | Jun | Jul | Aug | Sep | Oct | Nov | Dec |
|---|---|---|---|---|---|---|---|---|---|---|---|---|
| 1993 | 43,736 | 41,783 | 40,206 | 41,274 | 42,895 | 45,522 | 42,184 | 44,352 | 43,325 | 46,534 | 47,934 | 44,009 |
| 1994 | 44,161 | 39,748 | 41,639 | 39,647 | 40,562 | 39,118 | 39,646 | 40,770 | 44,314 | 42,931 | 43,453 | 41,684 |
| 1995 | 43,336 | 36,308 | 37,569 | 36,965 | 38,379 | 35,721 | 36,570 | 37,684 | 39,383 | 37,769 | 37,241 | 36,998 |
| 1996 | 35,268 | 31,508 | 31,370 | 33,368 | 33,977 | 34,617 | 34,519 | 35,563 | 37,590 | 38,032 | 42,341 | 45,746 |
| 1997 | 41,597 | 39,738 | 41,005 | 40,469 | 39,035 | 38,976 | 35,328 | 36,177 | 34,569 | 35,710 | 37,642 | 40,261 |
| 1998 | 39,517 | 38,118 | 40,414 | 38,822 | 38,657 | 39,556 | 39,465 | 41,510 | 39,501 | 40,705 | 42,508 | 44,636 |
| 1999 | 43,820 | 42,021 | 39,376 | 40,087 | 40,287 | 42,338 | 44,118 | 38,485 | 40,569 | 40,390 | 40,229 | 35,693 |
| 2000 | 35,929 | 34,229 | 36,345 | 35,209 | 37,232 | 37,030 | 35,321 | 37,006 | 37,547 | 34,986 | 38,930 | 36,193 |
| 2001 | 37,102 | 38,210 | 38,830 | 39,629 | 40,971 | 41,643 | 39,101 | 34,892 | 37,171 | 38,157 | 39,113 | 41,046 |
| 2002 | 41,242 | 38,817 | 34,166 | 34,541 | 33,873 | 32,627 | 33,458 | 31,928 | 32,906 | 33,525 | 35,457 | 31,103 |
| 2003 | 31,326 | 30,901 | 31,913 | 30,667 | 35,765 | 35,208 | 31,475 | 30,040 | 31,587 | 33,718 | 35,752 | 37,548 |
| 2004 | 37,811 | 39,571 | 38,424 | 35,997 | 36,091 | 37,286 | 34,618 | 37,025 | 33,792 | 36,045 | 42,238 | 42,078 |
| 2005 | 40,851 | 40,792 | 39,566 | 36,822 | 37,905 | 37,572 | 36,637 | 32,878 | 34,041 | 35,486 | 39,660 | 37,212 |
| 2006 | 40,774 | 41,579 | 40,830 | 39,078 | 41,138 | 42,662 | 42,888 | 41,762 | 43,373 | 41,894 | 43,355 | 42,313 |
| 2007 | 42,248 | 35,800 | 39,540 | 38,330 | 36,497 | 36,121 | 39,631 | 36,380 | 37,032 | 38,769 | 38,768 | 39,316 |
| 2008 | 39,261 | 39,431 | 39,814 | 39,432 | 40,025 | 41,170 | 36,725 | 38,592 | 38,909 | 39,407 | 38,628 | 35,988 |
| 2009 | 33,538 | 38,284 | 38,376 | 34,476 | 38,392 | 36,901 | 35,237 | 33,368 | 35,194 | 35,131 | 36,377 | 37,168 |
| 2010 | 40,260 | 41,380 | 40,690 | 43,538 | 45,601 | 42,667 | 41,263 | 38,827 | 40,089 | 41,107 | 40,534 | 41,347 |
| 2011 | 39,440 | 35,346 | 37,740 | 39,910 | 37,570 | 37,893 | 38,160 | 39,040 | 34,709 | 36,931 | 39,318 | 34,189 |
| 2012 | 33,956 | 35,993 | 36,644 | 34,623 | 33,034 | 36,932 | 35,897 | 34,158 | 35,519 | 37,424 | 37,027 | 33,951 |
| 2013 | 35,531 | 37,985 | 36,986 | 40,316 | 38,965 | 37,556 | 37,801 | 35,245 | 35,585 | 36,319 | 35,714 | 38,144 |
| 2014 | 36,874 | 36,354 | 36,049 | 35,965 | 38,314 | 36,643 | 35,692 | 37,501 | 36,579 | 36,761 | 36,301 | 33,656 |
| 2015 | 34,383 | 37,090 | 38,437 | 39,205 | 41,360 | 41,970 | 40,121 | 38,912 | 41,554 | 43,205 | 43,585 | 42,142 |
| 2016 | 44,062 | 45,929 | 44,531 | 43,176 | 40,277 | 40,390 | 38,535 | 39,624 | 38,872 | 39,273 | 40,794 | 41,469 |
| 2017 | 38,496 | 37,801 | 37,508 | 36,511 | 37,038 | 33,177 | 31,185 | 32,650 | 33,597 | 29,950 | 29,788 | 29,371 |
| 2018 | 32,448 | 32,902 | 35,038 | 32,330 | 31,853 | 30,020 | 29,326 | 27,837 | 28,696 | 29,226 | 29,783 | 28,308 |
| 2019 | 29,743 | 28,404 | 29,174 | 28,924 | 30,150 | 30,461 | 30,704 | 28,782 | 30,021 | 29,675 | 32,654 | 30,512 |
| 2020 | 30,305 | 31,328 | 34,819 | 36,175 | 38,454 | 39,524 | 35,871 | 34,386 | 32,124 | 31,212 | 31,134 | 30,173 |
| 2021 | 32,184 | 31,425 | 30,927 | 31,854 | 32,030 | 31,524 | 29,382 | 29,819 | 27,760 | 28,733 | 27,900 | 25,770 |
| 2022 | 27,070 | 28,038 | 28,095 | 29,493 | 29,485 | 29,251 | 29,196 | 28,607 | 27,391 | 30,023 | 29,365 | 30,739 |
| 2023 | 32,104 | 31,321 | 29,559 | 32,342 | 33,144 | 30,473 | 28,509 | 25,972 | 27,775 | 27,588 | 25,844 | 24,094 |
| 2024 | 26,939 | 28,888 | 29,866 | 27,853 | 29,043 | 27,489 | ||||||
| - = No Data Reported; -- = Not Applicable; NA = Not Available; W = Withheld to avoid disclosure of individual company data. |
| Release Date: 8/30/2024 |
| Next Release Date: 9/30/2024 |