|
Download Data (XLS File) |
|
||||||||
|
||||||||
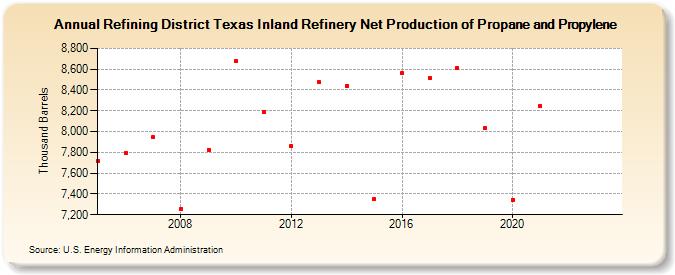
| Refining District Texas Inland Refinery Net Production of Propane and Propylene (Thousand Barrels) | ||||||||
| Decade | Year-0 | Year-1 | Year-2 | Year-3 | Year-4 | Year-5 | Year-6 | Year-7 | Year-8 | Year-9 |
|---|---|---|---|---|---|---|---|---|---|---|
| 2000's | 7,721 | 7,796 | 7,943 | 7,258 | 7,825 | |||||
| 2010's | 8,674 | 8,185 | 7,861 | 8,476 | 8,442 | 7,351 | 8,560 | 8,517 | 8,613 | 8,033 |
| 2020's | 7,346 | 8,242 | -- | -- |
| - = No Data Reported; -- = Not Applicable; NA = Not Available; W = Withheld to avoid disclosure of individual company data. |
| Release Date: 6/28/2024 |
| Next Release Date: 8/30/2024 |