|
Download Data (XLS File) |
|
||||||||
|
||||||||
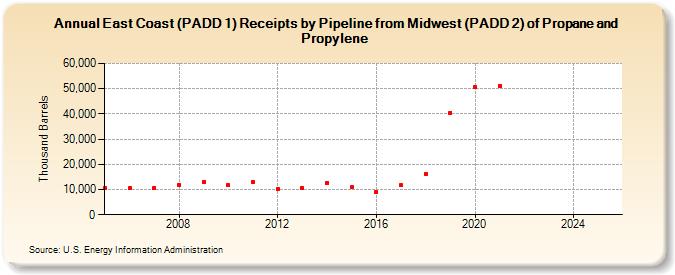
| East Coast (PADD 1) Receipts by Pipeline from Midwest (PADD 2) of Propane and Propylene (Thousand Barrels) | ||||||||
| Decade | Year-0 | Year-1 | Year-2 | Year-3 | Year-4 | Year-5 | Year-6 | Year-7 | Year-8 | Year-9 |
|---|---|---|---|---|---|---|---|---|---|---|
| 2000's | 10,603 | 10,429 | 10,646 | 11,983 | 13,043 | |||||
| 2010's | 11,686 | 12,847 | 10,161 | 10,582 | 12,729 | 10,851 | 8,817 | 11,671 | 16,320 | 40,493 |
| 2020's | 50,555 | 51,249 | -- | -- |
| - = No Data Reported; -- = Not Applicable; NA = Not Available; W = Withheld to avoid disclosure of individual company data. |
| Release Date: 6/28/2024 |
| Next Release Date: 8/30/2024 |