|
Download Data (XLS File) |
|
||||||||
|
||||||||
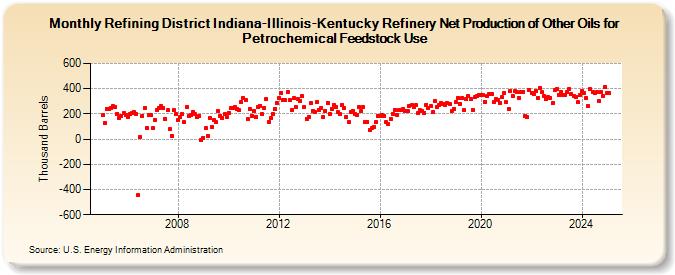
| Refining District Indiana-Illinois-Kentucky Refinery Net Production of Other Oils for Petrochemical Feedstock Use (Thousand Barrels) | ||||||||
| Year | Jan | Feb | Mar | Apr | May | Jun | Jul | Aug | Sep | Oct | Nov | Dec |
|---|---|---|---|---|---|---|---|---|---|---|---|---|
| 2005 | 188 | 124 | 240 | 238 | 248 | 262 | 253 | 203 | 171 | 184 | 208 | 191 |
| 2006 | 177 | 199 | 207 | 212 | 200 | -446 | 17 | 186 | 250 | 90 | 189 | 190 |
| 2007 | 87 | 154 | 231 | 245 | 260 | 243 | 163 | 228 | 78 | 28 | 228 | 200 |
| 2008 | 153 | 178 | 199 | 135 | 253 | 182 | 195 | 218 | 199 | 175 | 186 | -10 |
| 2009 | 12 | 86 | 26 | 170 | 98 | 151 | 134 | 221 | 186 | 171 | 197 | 177 |
| 2010 | 210 | 243 | 250 | 254 | 242 | 228 | 297 | 328 | 308 | 156 | 240 | 184 |
| 2011 | 224 | 177 | 253 | 265 | 196 | 245 | 318 | 135 | 169 | 198 | 240 | 286 |
| 2012 | 327 | 369 | 307 | 307 | 372 | 307 | 230 | 325 | 254 | 322 | 303 | 339 |
| 2013 | 254 | 163 | 177 | 283 | 226 | 214 | 293 | 234 | 247 | 179 | 224 | 290 |
| 2014 | 200 | 239 | 273 | 251 | 215 | 197 | 273 | 247 | 178 | 133 | 217 | 223 |
| 2015 | 199 | 192 | 254 | 220 | 251 | 135 | 139 | 72 | 85 | 99 | 134 | 185 |
| 2016 | 183 | 189 | 187 | 132 | 119 | 160 | 200 | 230 | 194 | 231 | 230 | 238 |
| 2017 | 221 | 221 | 261 | 267 | 255 | 267 | 205 | 227 | 223 | 210 | 274 | 246 |
| 2018 | 259 | 212 | 299 | 257 | 272 | 288 | 282 | 273 | 285 | 282 | 219 | 238 |
| 2019 | 291 | 325 | 280 | 327 | 230 | 316 | 341 | 319 | 233 | 331 | 343 | 353 |
| 2020 | 352 | 347 | 298 | 342 | 355 | 360 | 293 | 316 | 314 | 285 | 332 | 366 |
| 2021 | 292 | 240 | 381 | 345 | 381 | 372 | 328 | 375 | 377 | 183 | 172 | 386 |
| 2022 | 369 | 356 | 382 | 330 | 404 | 371 | 340 | 318 | 332 | 328 | 286 | 388 |
| 2023 | 399 | 351 | 377 | 351 | 353 | 374 | 398 | 361 | 345 | 337 | 292 | 348 |
| 2024 | 382 | 364 | 329 | 264 | ||||||||
| - = No Data Reported; -- = Not Applicable; NA = Not Available; W = Withheld to avoid disclosure of individual company data. |
| Release Date: 6/28/2024 |
| Next Release Date: 7/31/2024 |