|
Download Data (XLS File) |
|
||||||||
|
||||||||
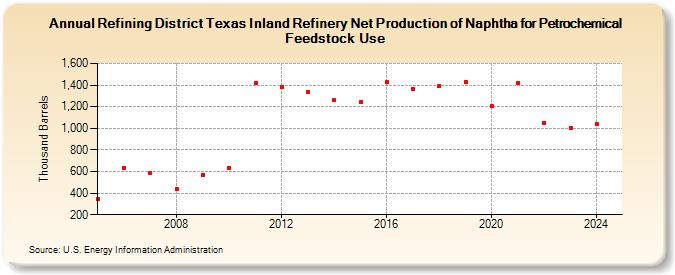
| Refining District Texas Inland Refinery Net Production of Naphtha for Petrochemical Feedstock Use (Thousand Barrels) | ||||||||
| Decade | Year-0 | Year-1 | Year-2 | Year-3 | Year-4 | Year-5 | Year-6 | Year-7 | Year-8 | Year-9 |
|---|---|---|---|---|---|---|---|---|---|---|
| 2000's | 346 | 637 | 589 | 440 | 570 | |||||
| 2010's | 633 | 1,415 | 1,386 | 1,337 | 1,261 | 1,243 | 1,432 | 1,368 | 1,391 | 1,431 |
| 2020's | 1,211 | 1,423 | 1,053 | 1,007 |
| - = No Data Reported; -- = Not Applicable; NA = Not Available; W = Withheld to avoid disclosure of individual company data. |
| Release Date: 6/28/2024 |
| Next Release Date: 8/30/2024 |