|
Download Data (XLS File) |
|
||||||||
|
||||||||
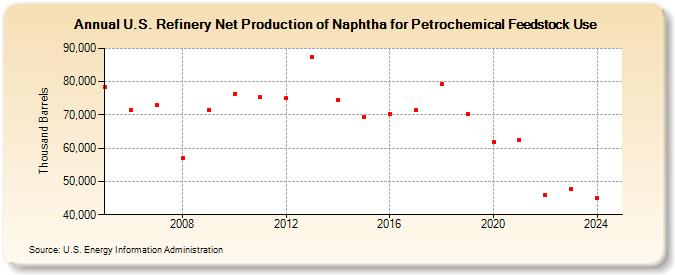
| U.S. Refinery Net Production of Naphtha for Petrochemical Feedstock Use (Thousand Barrels) | ||||||||
| Decade | Year-0 | Year-1 | Year-2 | Year-3 | Year-4 | Year-5 | Year-6 | Year-7 | Year-8 | Year-9 |
|---|---|---|---|---|---|---|---|---|---|---|
| 2000's | 78,286 | 71,548 | 73,034 | 56,999 | 71,603 | |||||
| 2010's | 76,367 | 75,347 | 75,054 | 87,357 | 74,553 | 69,375 | 70,159 | 71,578 | 79,292 | 70,277 |
| 2020's | 61,912 | 62,548 | 45,932 | 47,800 |
| - = No Data Reported; -- = Not Applicable; NA = Not Available; W = Withheld to avoid disclosure of individual company data. |
| Release Date: 6/28/2024 |
| Next Release Date: 8/30/2024 |