|
Download Data (XLS File) |
|
||||||||
|
||||||||
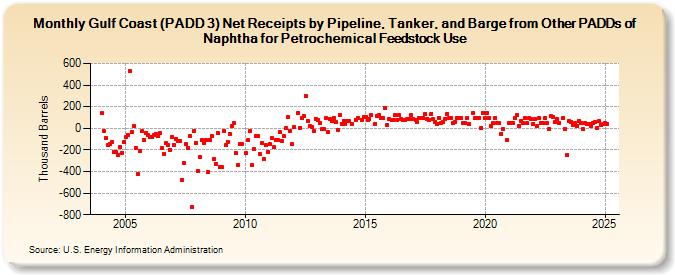
| Gulf Coast (PADD 3) Net Receipts by Pipeline, Tanker, and Barge from Other PADDs of Naphtha for Petrochemical Feedstock Use (Thousand Barrels) | ||||||||
| Year | Jan | Feb | Mar | Apr | May | Jun | Jul | Aug | Sep | Oct | Nov | Dec |
|---|---|---|---|---|---|---|---|---|---|---|---|---|
| 2004 | 138 | -26 | -92 | -155 | -146 | -126 | -221 | -216 | -249 | -171 | -226 | -131 |
| 2005 | -84 | -63 | 529 | -34 | 23 | -182 | -424 | -208 | -25 | -106 | -43 | -63 |
| 2006 | -84 | -78 | -65 | -55 | -73 | -48 | -179 | -237 | -139 | -154 | -198 | -77 |
| 2007 | -153 | -98 | -117 | -116 | -476 | -321 | -150 | -182 | -74 | -733 | -26 | -138 |
| 2008 | -391 | -264 | -109 | -138 | -109 | -407 | -107 | -72 | -285 | -328 | -42 | -358 |
| 2009 | -358 | -27 | -156 | -124 | -53 | 20 | 49 | -228 | -340 | -148 | -148 | |
| 2010 | -232 | -109 | -29 | -343 | -188 | -73 | -74 | -238 | -137 | -287 | -155 | -219 |
| 2011 | -148 | -86 | -174 | -104 | -106 | -37 | -116 | -72 | 0 | 102 | -23 | -150 |
| 2012 | 11 | 143 | 3 | 98 | 116 | 303 | 70 | 20 | 9 | -23 | 89 | |
| 2013 | 81 | 53 | -9 | -8 | 92 | -35 | 89 | 63 | 94 | 54 | -13 | 122 |
| 2014 | 41 | 72 | 42 | 70 | 66 | 40 | 81 | 97 | 81 | 106 | ||
| 2015 | 106 | 81 | 85 | 122 | 40 | 118 | 122 | 91 | 93 | 187 | 32 | |
| 2016 | 82 | 80 | 80 | 121 | 81 | 120 | 82 | 79 | 79 | 82 | 85 | 124 |
| 2017 | 82 | 81 | 54 | 97 | 94 | 94 | 136 | 90 | 81 | 135 | 82 | 59 |
| 2018 | 43 | 94 | 45 | 54 | 89 | 134 | 93 | 94 | 45 | 54 | 97 | 95 |
| 2019 | 97 | 45 | 46 | 98 | 43 | 140 | 94 | 91 | 97 | 1 | 146 | |
| 2020 | 97 | 137 | 96 | 23 | 45 | 97 | 51 | 45 | -55 | -5 | -105 | |
| 2021 | 46 | 49 | 49 | 97 | 122 | 22 | 72 | 49 | 93 | 45 | 97 | 83 |
| 2022 | 42 | 84 | 22 | 97 | 48 | 49 | 94 | 48 | -6 | 113 | 109 | 57 |
| 2023 | 85 | 47 | 98 | -8 | -244 | 71 | 57 | 33 | 45 | 24 | 67 | |
| 2024 | 46 | -9 | 49 | 40 | ||||||||
| - = No Data Reported; -- = Not Applicable; NA = Not Available; W = Withheld to avoid disclosure of individual company data. |
| Release Date: 6/28/2024 |
| Next Release Date: 7/31/2024 |