|
Download Data (XLS File) |
|
||||||||
|
||||||||
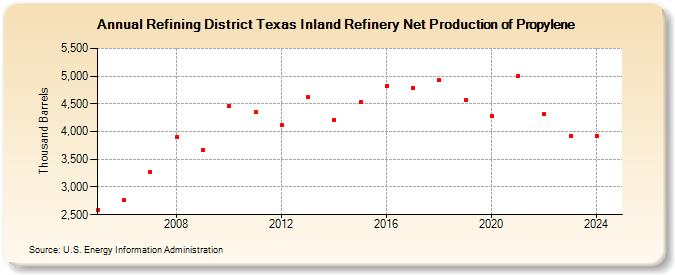
| Refining District Texas Inland Refinery Net Production of Propylene (Thousand Barrels) | ||||||||
| Decade | Year-0 | Year-1 | Year-2 | Year-3 | Year-4 | Year-5 | Year-6 | Year-7 | Year-8 | Year-9 |
|---|---|---|---|---|---|---|---|---|---|---|
| 2000's | 2,581 | 2,769 | 3,273 | 3,899 | 3,662 | |||||
| 2010's | 4,461 | 4,351 | 4,121 | 4,620 | 4,209 | 4,526 | 4,820 | 4,784 | 4,926 | 4,578 |
| 2020's | 4,289 | 5,011 | 4,308 | 3,923 |
| - = No Data Reported; -- = Not Applicable; NA = Not Available; W = Withheld to avoid disclosure of individual company data. |
| Release Date: 6/28/2024 |
| Next Release Date: 8/30/2024 |
Referring Pages: