|
Download Data (XLS File) |
|
||||||||
|
||||||||
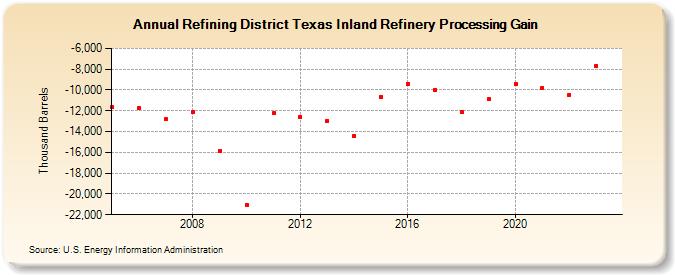
| Refining District Texas Inland Refinery Processing Gain (Thousand Barrels) | ||||||||
| Decade | Year-0 | Year-1 | Year-2 | Year-3 | Year-4 | Year-5 | Year-6 | Year-7 | Year-8 | Year-9 |
|---|---|---|---|---|---|---|---|---|---|---|
| 2000's | -11,680 | -11,743 | -12,832 | -12,160 | -15,841 | |||||
| 2010's | -21,034 | -12,258 | -12,558 | -12,953 | -14,406 | -10,630 | -9,401 | -9,958 | -12,158 | -10,894 |
| 2020's | -9,437 | -9,810 | -10,466 | -7,713 |
| - = No Data Reported; -- = Not Applicable; NA = Not Available; W = Withheld to avoid disclosure of individual company data. |
| Release Date: 6/28/2024 |
| Next Release Date: 8/30/2024 |