|
Download Data (XLS File) |
|
||||||||
|
||||||||
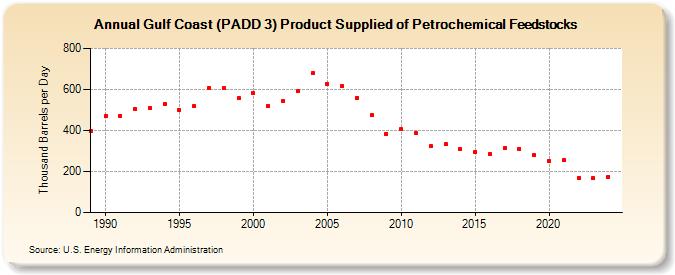
| Gulf Coast (PADD 3) Product Supplied of Petrochemical Feedstocks (Thousand Barrels per Day) | ||||||||
| Decade | Year-0 | Year-1 | Year-2 | Year-3 | Year-4 | Year-5 | Year-6 | Year-7 | Year-8 | Year-9 |
|---|---|---|---|---|---|---|---|---|---|---|
| 1980's | 396 | |||||||||
| 1990's | 470 | 472 | 504 | 510 | 529 | 499 | 518 | 608 | 605 | 557 |
| 2000's | 581 | 519 | 542 | 592 | 680 | 626 | 616 | 560 | 475 | 385 |
| 2010's | 405 | 387 | 322 | 332 | 309 | 296 | 286 | 313 | 310 | 280 |
| 2020's | 252 | 254 | 168 | 171 |
| - = No Data Reported; -- = Not Applicable; NA = Not Available; W = Withheld to avoid disclosure of individual company data. |
| Release Date: 6/28/2024 |
| Next Release Date: 8/30/2024 |