|
Download Data (XLS File) |
|
||||||||
|
||||||||
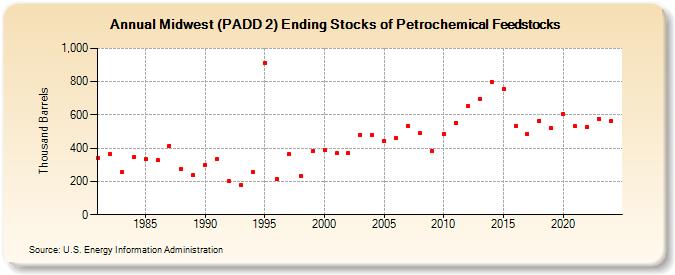
| Midwest (PADD 2) Ending Stocks of Petrochemical Feedstocks (Thousand Barrels) | ||||||||
| Decade | Year-0 | Year-1 | Year-2 | Year-3 | Year-4 | Year-5 | Year-6 | Year-7 | Year-8 | Year-9 |
|---|---|---|---|---|---|---|---|---|---|---|
| 1980's | 343 | 368 | 255 | 347 | 333 | 327 | 416 | 273 | 239 | |
| 1990's | 298 | 336 | 201 | 176 | 256 | 913 | 213 | 363 | 234 | 381 |
| 2000's | 389 | 369 | 372 | 482 | 480 | 446 | 460 | 533 | 489 | 384 |
| 2010's | 487 | 550 | 653 | 698 | 800 | 755 | 533 | 488 | 565 | 520 |
| 2020's | 604 | 532 | 528 | 577 |
| - = No Data Reported; -- = Not Applicable; NA = Not Available; W = Withheld to avoid disclosure of individual company data. |
| Release Date: 6/28/2024 |
| Next Release Date: 8/30/2024 |