|
Download Data (XLS File) |
|
||||||||
|
||||||||
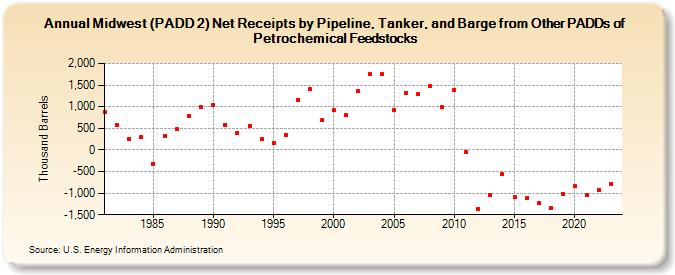
| Midwest (PADD 2) Net Receipts by Pipeline, Tanker, and Barge from Other PADDs of Petrochemical Feedstocks (Thousand Barrels) | ||||||||
| Decade | Year-0 | Year-1 | Year-2 | Year-3 | Year-4 | Year-5 | Year-6 | Year-7 | Year-8 | Year-9 |
|---|---|---|---|---|---|---|---|---|---|---|
| 1980's | 869 | 566 | 257 | 297 | -329 | 313 | 476 | 787 | 988 | |
| 1990's | 1,029 | 584 | 388 | 558 | 247 | 164 | 350 | 1,160 | 1,399 | 682 |
| 2000's | 914 | 802 | 1,361 | 1,762 | 1,745 | 925 | 1,324 | 1,298 | 1,472 | 985 |
| 2010's | 1,396 | -46 | -1,357 | -1,038 | -562 | -1,092 | -1,116 | -1,236 | -1,349 | -1,018 |
| 2020's | -839 | -1,051 | -922 | -797 |
| - = No Data Reported; -- = Not Applicable; NA = Not Available; W = Withheld to avoid disclosure of individual company data. |
| Release Date: 6/28/2024 |
| Next Release Date: 8/30/2024 |