|
Download Data (XLS File) |
|
||||||||
|
||||||||
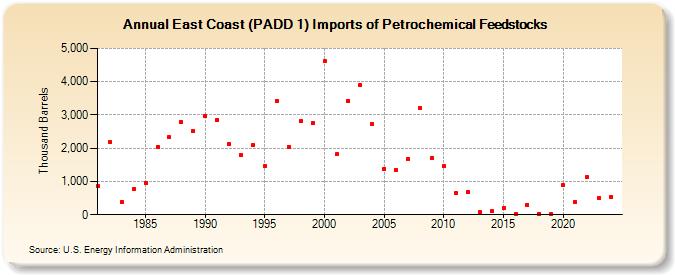
| East Coast (PADD 1) Imports of Petrochemical Feedstocks (Thousand Barrels) | ||||||||
| Decade | Year-0 | Year-1 | Year-2 | Year-3 | Year-4 | Year-5 | Year-6 | Year-7 | Year-8 | Year-9 |
|---|---|---|---|---|---|---|---|---|---|---|
| 1980's | 876 | 2,198 | 392 | 778 | 965 | 2,047 | 2,322 | 2,781 | 2,514 | |
| 1990's | 2,976 | 2,854 | 2,138 | 1,806 | 2,083 | 1,471 | 3,427 | 2,044 | 2,817 | 2,755 |
| 2000's | 4,609 | 1,817 | 3,432 | 3,902 | 2,713 | 1,376 | 1,344 | 1,675 | 3,195 | 1,706 |
| 2010's | 1,468 | 650 | 685 | 71 | 98 | 188 | 29 | 305 | 33 | 27 |
| 2020's | 884 | 385 | 1,124 | 509 |
| - = No Data Reported; -- = Not Applicable; NA = Not Available; W = Withheld to avoid disclosure of individual company data. |
| Release Date: 3/29/2024 |
| Next Release Date: 8/30/2024 |