|
Download Data (XLS File) |
|
||||||||
|
||||||||
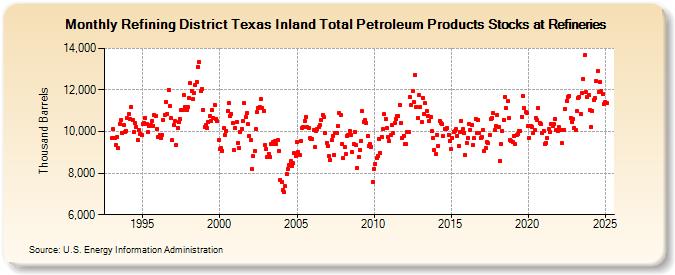
| Refining District Texas Inland Total Petroleum Products Stocks at Refineries (Thousand Barrels) | ||||||||
| Year | Jan | Feb | Mar | Apr | May | Jun | Jul | Aug | Sep | Oct | Nov | Dec |
|---|---|---|---|---|---|---|---|---|---|---|---|---|
| 1993 | 9,687 | 10,116 | 9,686 | 9,360 | 9,746 | 9,192 | 10,379 | 10,545 | 9,929 | 10,336 | 9,999 | 10,028 |
| 1994 | 10,638 | 10,834 | 10,612 | 11,203 | 10,536 | 9,986 | 10,401 | 10,219 | 9,612 | 10,062 | 9,879 | 9,820 |
| 1995 | 10,350 | 10,419 | 10,674 | 10,383 | 9,961 | 10,262 | 10,312 | 10,503 | 10,283 | 10,775 | 10,735 | 10,115 |
| 1996 | 9,726 | 9,851 | 9,712 | 9,842 | 10,563 | 10,820 | 11,441 | 10,856 | 12,018 | 11,238 | 10,646 | 9,572 |
| 1997 | 10,314 | 10,490 | 9,358 | 10,189 | 10,441 | 10,607 | 11,038 | 11,030 | 11,738 | 11,191 | 11,015 | 11,162 |
| 1998 | 11,630 | 12,331 | 11,966 | 11,560 | 11,876 | 12,221 | 12,401 | 13,109 | 13,345 | 11,954 | 12,068 | 11,044 |
| 1999 | 10,225 | 10,302 | 10,164 | 10,455 | 10,725 | 10,485 | 11,038 | 10,655 | 11,287 | 10,624 | 10,502 | 9,575 |
| 2000 | 9,141 | 9,193 | 9,087 | 10,173 | 9,843 | 10,040 | 10,989 | 11,356 | 10,727 | 10,854 | 10,409 | 9,111 |
| 2001 | 10,183 | 10,475 | 9,467 | 9,219 | 10,002 | 10,145 | 10,529 | 11,354 | 10,699 | 10,884 | 10,346 | 9,791 |
| 2002 | 9,592 | 8,205 | 8,819 | 9,074 | 10,102 | 10,935 | 11,109 | 11,171 | 11,577 | 11,129 | 11,002 | 9,350 |
| 2003 | 9,174 | 8,763 | 8,940 | 8,770 | 9,386 | 9,482 | 9,424 | 9,527 | 9,391 | 9,584 | 9,082 | 7,685 |
| 2004 | 7,550 | 7,192 | 7,077 | 7,362 | 7,940 | 8,192 | 8,403 | 8,563 | 8,334 | 8,473 | 8,956 | 8,845 |
| 2005 | 9,516 | 9,021 | 8,871 | 9,557 | 10,175 | 10,222 | 10,510 | 10,723 | 10,208 | 10,177 | 9,682 | 9,647 |
| 2006 | 9,625 | 10,064 | 9,245 | 10,025 | 10,114 | 10,215 | 10,329 | 10,534 | 10,817 | 10,681 | 9,922 | 9,470 |
| 2007 | 9,301 | 8,803 | 8,631 | 9,572 | 9,808 | 8,885 | 9,915 | 9,947 | 10,283 | 10,895 | 10,813 | 9,406 |
| 2008 | 8,722 | 9,261 | 8,908 | 9,809 | 9,857 | 10,033 | 9,855 | 9,002 | 9,399 | 9,970 | 9,338 | 8,255 |
| 2009 | 8,774 | 9,126 | 9,556 | 10,973 | 10,473 | 10,545 | 10,428 | 9,790 | 9,301 | 9,398 | 9,269 | 7,589 |
| 2010 | 8,218 | 8,457 | 8,712 | 8,840 | 9,626 | 8,982 | 9,757 | 10,103 | 10,832 | 10,622 | 10,178 | 9,736 |
| 2011 | 9,524 | 9,828 | 10,319 | 9,915 | 10,415 | 10,596 | 10,727 | 10,763 | 11,297 | 10,432 | 9,702 | 9,803 |
| 2012 | 9,388 | 9,400 | 9,990 | 9,986 | 11,668 | 11,267 | 11,961 | 11,419 | 12,724 | 11,193 | 10,657 | 11,741 |
| 2013 | 11,190 | 10,452 | 11,631 | 10,834 | 11,361 | 10,996 | 10,763 | 10,512 | 10,693 | 10,006 | 9,704 | 9,112 |
| 2014 | 8,903 | 9,855 | 9,325 | 10,530 | 10,420 | 10,358 | 9,792 | 10,115 | 10,117 | 10,159 | 9,847 | 9,558 |
| 2015 | 9,168 | 9,688 | 9,989 | 10,004 | 10,108 | 9,799 | 9,329 | 9,971 | 10,496 | 10,106 | 9,945 | 8,851 |
| 2016 | 9,462 | 9,704 | 10,360 | 10,088 | 10,335 | 9,366 | 9,686 | 10,624 | 9,947 | 10,566 | 9,945 | 9,685 |
| 2017 | 9,717 | 10,068 | 9,060 | 9,213 | 9,480 | 9,426 | 9,835 | 10,580 | 10,649 | 10,874 | 10,054 | 10,287 |
| 2018 | 10,804 | 10,209 | 8,605 | 9,404 | 10,012 | 10,556 | 11,682 | 11,126 | 11,452 | 10,653 | 9,606 | 9,554 |
| 2019 | 9,521 | 9,779 | 9,378 | 9,832 | 9,904 | 10,047 | 10,033 | 10,724 | 11,733 | 11,111 | 10,936 | 10,907 |
| 2020 | 10,244 | 9,696 | 10,261 | 10,219 | 9,943 | 10,061 | 10,664 | 10,579 | 11,123 | 10,419 | 10,342 | 9,919 |
| 2021 | 10,050 | 9,403 | 9,467 | 9,688 | 10,124 | 9,964 | 10,360 | 10,278 | 10,346 | 10,594 | 10,085 | 10,044 |
| 2022 | 10,198 | 10,072 | 9,435 | 10,069 | 10,084 | 11,104 | 11,463 | 11,668 | 11,726 | 10,670 | 10,483 | 10,602 |
| 2023 | 10,179 | 10,090 | 10,958 | 11,592 | 11,666 | 10,864 | 11,862 | 12,533 | 13,661 | 11,888 | 11,648 | 11,735 |
| 2024 | 11,014 | 10,229 | 11,012 | 11,521 | ||||||||
| - = No Data Reported; -- = Not Applicable; NA = Not Available; W = Withheld to avoid disclosure of individual company data. |
| Release Date: 6/28/2024 |
| Next Release Date: 7/31/2024 |
Referring Pages: