|
Download Data (XLS File) |
|
||||||||
|
||||||||
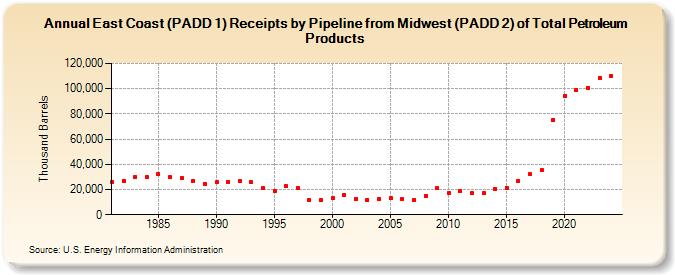
| East Coast (PADD 1) Receipts by Pipeline from Midwest (PADD 2) of Total Petroleum Products (Thousand Barrels) | ||||||||
| Decade | Year-0 | Year-1 | Year-2 | Year-3 | Year-4 | Year-5 | Year-6 | Year-7 | Year-8 | Year-9 |
|---|---|---|---|---|---|---|---|---|---|---|
| 1980's | 25,612 | 26,967 | 29,928 | 29,849 | 32,411 | 29,723 | 29,402 | 26,702 | 24,584 | |
| 1990's | 25,600 | 26,052 | 27,087 | 25,753 | 20,820 | 18,882 | 22,738 | 21,070 | 11,716 | 11,643 |
| 2000's | 13,404 | 15,635 | 12,806 | 11,829 | 12,816 | 12,926 | 12,581 | 12,015 | 15,187 | 21,122 |
| 2010's | 17,242 | 18,682 | 17,203 | 17,369 | 20,516 | 21,510 | 26,567 | 31,977 | 35,328 | 75,479 |
| 2020's | 94,543 | 99,017 | 100,775 | 106,679 |
| - = No Data Reported; -- = Not Applicable; NA = Not Available; W = Withheld to avoid disclosure of individual company data. |
| Release Date: 6/28/2024 |
| Next Release Date: 8/30/2024 |