|
Download Data (XLS File) |
|
||||||||
|
||||||||
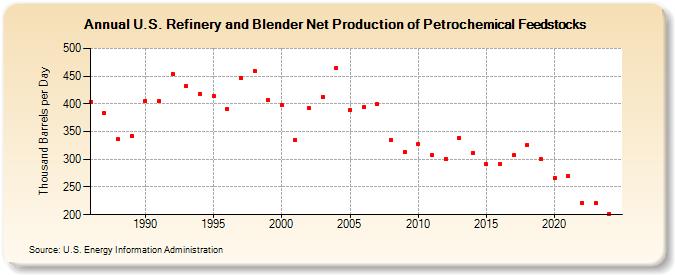
| U.S. Refinery and Blender Net Production of Petrochemical Feedstocks (Thousand Barrels per Day) | ||||||||
| Decade | Year-0 | Year-1 | Year-2 | Year-3 | Year-4 | Year-5 | Year-6 | Year-7 | Year-8 | Year-9 |
|---|---|---|---|---|---|---|---|---|---|---|
| 1980's | 404 | 383 | 336 | 342 | ||||||
| 1990's | 406 | 405 | 454 | 432 | 418 | 415 | 391 | 447 | 460 | 407 |
| 2000's | 398 | 335 | 392 | 413 | 465 | 389 | 394 | 399 | 335 | 313 |
| 2010's | 327 | 308 | 301 | 339 | 312 | 291 | 291 | 307 | 326 | 300 |
| 2020's | 267 | 269 | 222 | 220 |
| - = No Data Reported; -- = Not Applicable; NA = Not Available; W = Withheld to avoid disclosure of individual company data. |
| Release Date: 6/28/2024 |
| Next Release Date: 8/30/2024 |