|
Download Data (XLS File) |
|
||||||||
|
||||||||
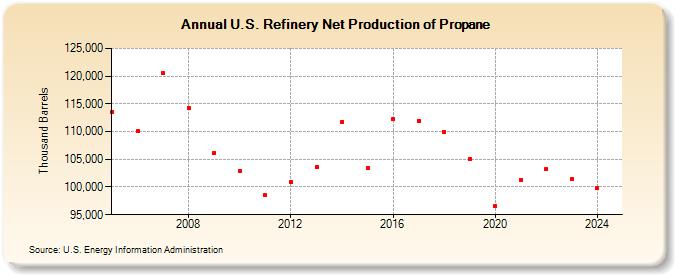
| U.S. Refinery Net Production of Propane (Thousand Barrels) | ||||||||
| Decade | Year-0 | Year-1 | Year-2 | Year-3 | Year-4 | Year-5 | Year-6 | Year-7 | Year-8 | Year-9 |
|---|---|---|---|---|---|---|---|---|---|---|
| 2000's | 113,604 | 110,110 | 120,596 | 114,268 | 106,177 | |||||
| 2010's | 102,913 | 98,508 | 100,933 | 103,568 | 111,813 | 103,423 | 112,289 | 111,964 | 109,993 | 105,084 |
| 2020's | 96,553 | 101,325 | 103,236 | 101,618 |
| - = No Data Reported; -- = Not Applicable; NA = Not Available; W = Withheld to avoid disclosure of individual company data. |
| Release Date: 6/28/2024 |
| Next Release Date: 8/30/2024 |
Referring Pages: