|
Download Data (XLS File) |
|
||||||||
|
||||||||
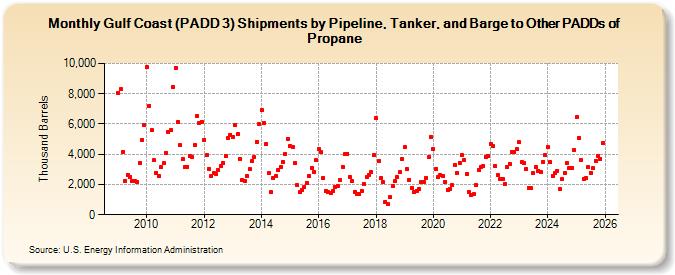
| Gulf Coast (PADD 3) Shipments by Pipeline, Tanker, and Barge to Other PADDs of Propane (Thousand Barrels) | ||||||||
| Year | Jan | Feb | Mar | Apr | May | Jun | Jul | Aug | Sep | Oct | Nov | Dec |
|---|---|---|---|---|---|---|---|---|---|---|---|---|
| 2009 | 8,055 | 8,294 | 4,163 | 2,248 | 2,637 | 2,507 | 2,261 | 2,228 | 2,166 | 3,441 | 4,961 | 5,913 |
| 2010 | 9,756 | 7,216 | 5,585 | 3,594 | 2,782 | 2,541 | 3,129 | 3,412 | 4,100 | 5,500 | 5,574 | 8,457 |
| 2011 | 9,718 | 6,149 | 4,588 | 3,651 | 3,151 | 3,177 | 3,911 | 3,825 | 4,590 | 6,549 | 6,085 | 6,152 |
| 2012 | 4,937 | 3,926 | 3,026 | 2,581 | 2,744 | 2,682 | 2,947 | 3,199 | 3,404 | 3,863 | 5,049 | 5,304 |
| 2013 | 5,167 | 5,939 | 5,333 | 3,692 | 2,295 | 2,221 | 2,572 | 3,022 | 3,559 | 3,797 | 4,836 | 5,991 |
| 2014 | 6,918 | 6,085 | 4,675 | 2,731 | 1,480 | 2,433 | 2,574 | 2,929 | 3,171 | 3,503 | 4,018 | 5,023 |
| 2015 | 4,529 | 4,470 | 3,438 | 1,952 | 1,478 | 1,616 | 1,816 | 2,125 | 2,587 | 3,116 | 2,841 | 3,586 |
| 2016 | 4,333 | 4,114 | 2,455 | 1,573 | 1,470 | 1,413 | 1,568 | 1,842 | 1,894 | 2,266 | 3,183 | 3,997 |
| 2017 | 4,034 | 2,505 | 2,202 | 1,518 | 1,348 | 1,341 | 1,583 | 2,054 | 2,493 | 2,646 | 2,818 | 3,938 |
| 2018 | 6,407 | 3,528 | 2,399 | 2,140 | 867 | 734 | 1,141 | 1,915 | 2,201 | 2,496 | 2,793 | 3,701 |
| 2019 | 4,469 | 3,002 | 2,303 | 1,786 | 1,499 | 1,585 | 1,726 | 2,132 | 2,135 | 2,428 | 3,784 | 5,149 |
| 2020 | 4,328 | 3,028 | 2,484 | 2,595 | 2,571 | 2,190 | 1,666 | 1,713 | 1,944 | 3,277 | 2,755 | 3,424 |
| 2021 | 3,925 | 3,604 | 2,690 | 1,478 | 1,321 | 1,345 | 1,981 | 2,941 | 3,182 | 3,225 | 3,802 | 3,890 |
| 2022 | 4,674 | 4,521 | 3,213 | 2,606 | 2,375 | 2,333 | 2,038 | 3,161 | 3,353 | 4,161 | 4,124 | 4,328 |
| 2023 | 4,780 | 3,486 | 3,393 | 3,025 | 1,795 | 1,736 | 2,763 | 3,149 | 2,918 | 2,849 | 3,510 | 3,959 |
| 2024 | 4,467 | 3,483 | 2,567 | 2,752 | ||||||||
| - = No Data Reported; -- = Not Applicable; NA = Not Available; W = Withheld to avoid disclosure of individual company data. |
| Release Date: 6/28/2024 |
| Next Release Date: 7/31/2024 |