|
Download Data (XLS File) |
|
||||||||
|
||||||||
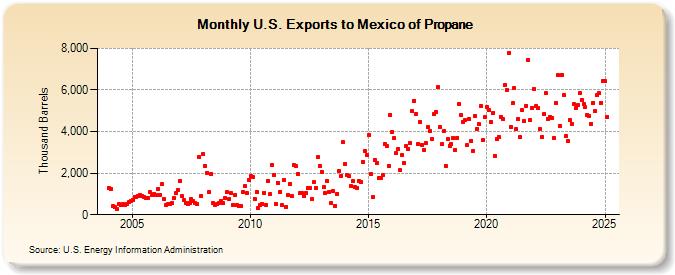
| U.S. Exports to Mexico of Propane (Thousand Barrels) | ||||||||
| Year | Jan | Feb | Mar | Apr | May | Jun | Jul | Aug | Sep | Oct | Nov | Dec |
|---|---|---|---|---|---|---|---|---|---|---|---|---|
| 2004 | 1,292 | 1,249 | 398 | 359 | 297 | 495 | 451 | 495 | 488 | 521 | 595 | 666 |
| 2005 | 717 | 860 | 863 | 880 | 942 | 904 | 839 | 802 | 806 | 1,080 | 934 | 1,020 |
| 2006 | 947 | 1,234 | 970 | 1,465 | 745 | 476 | 508 | 532 | 569 | 797 | 1,046 | 1,182 |
| 2007 | 1,629 | 884 | 688 | 574 | 523 | 578 | 734 | 637 | 560 | 527 | 2,771 | 907 |
| 2008 | 2,914 | 2,338 | 2,024 | 1,090 | 1,966 | 556 | 482 | 518 | 562 | 672 | 563 | 783 |
| 2009 | 1,083 | 766 | 1,039 | 460 | 934 | 445 | 403 | 430 | 1,073 | 1,381 | 1,033 | 1,665 |
| 2010 | 1,849 | 1,825 | 759 | 1,085 | 316 | 483 | 508 | 1,061 | 469 | 1,645 | 974 | 2,381 |
| 2011 | 1,927 | 505 | 1,538 | 1,096 | 463 | 1,650 | 388 | 946 | 1,498 | 885 | 2,378 | 2,329 |
| 2012 | 1,959 | 1,037 | 1,041 | 879 | 1,048 | 1,269 | 1,302 | 742 | 1,552 | 1,297 | 2,763 | 2,356 |
| 2013 | 2,068 | 1,312 | 1,054 | 1,613 | 1,113 | 544 | 1,126 | 432 | 1,011 | 2,080 | 1,883 | 3,480 |
| 2014 | 2,430 | 1,915 | 1,856 | 1,376 | 1,602 | 1,328 | 1,308 | 1,614 | 1,566 | 2,545 | 3,050 | 2,874 |
| 2015 | 3,828 | 1,941 | 843 | 2,655 | 2,480 | 1,749 | 1,759 | 1,905 | 3,409 | 3,310 | 2,358 | 4,809 |
| 2016 | 3,970 | 3,694 | 2,960 | 3,157 | 2,130 | 2,884 | 2,506 | 3,316 | 3,158 | 3,455 | 4,968 | 5,488 |
| 2017 | 4,849 | 3,417 | 4,456 | 3,375 | 3,126 | 3,430 | 4,202 | 4,012 | 3,649 | 4,824 | 4,949 | 6,134 |
| 2018 | 4,202 | 3,379 | 4,037 | 2,360 | 3,650 | 3,327 | 3,378 | 3,683 | 3,125 | 3,703 | 5,316 | 4,787 |
| 2019 | 4,477 | 4,539 | 3,352 | 4,600 | 3,569 | 3,082 | 4,753 | 4,144 | 4,347 | 5,240 | 3,597 | 4,684 |
| 2020 | 5,168 | 5,024 | 4,483 | 4,887 | 2,828 | 3,624 | 3,738 | 4,713 | 4,590 | 6,235 | 6,002 | 7,787 |
| 2021 | 4,242 | 5,350 | 6,092 | 4,131 | 4,599 | 3,732 | 5,017 | 4,518 | 5,243 | 7,441 | 4,547 | 5,133 |
| 2022 | 6,037 | 5,206 | 5,154 | 4,107 | 3,750 | 4,833 | 5,831 | 4,588 | 4,703 | 4,655 | 3,703 | 5,367 |
| 2023 | 5,480 | 3,623 | 6,064 | 4,436 | 2,683 | 2,902 | 3,682 | 3,565 | 4,334 | 5,130 | 5,260 | 5,864 |
| 2024 | 5,527 | |||||||||||
| - = No Data Reported; -- = Not Applicable; NA = Not Available; W = Withheld to avoid disclosure of individual company data. |
| Release Date: 3/29/2024 |
| Next Release Date: 4/30/2024 |