|
Download Data (XLS File) |
|
||||||||
|
||||||||
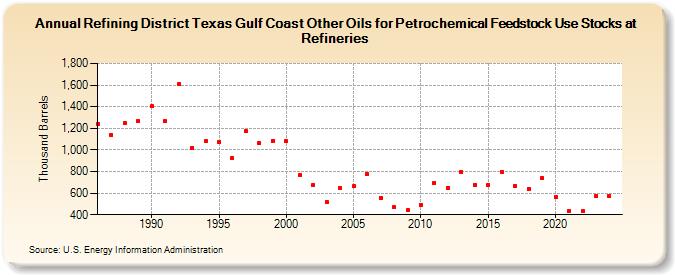
| Refining District Texas Gulf Coast Other Oils for Petrochemical Feedstock Use Stocks at Refineries (Thousand Barrels) | ||||||||
| Decade | Year-0 | Year-1 | Year-2 | Year-3 | Year-4 | Year-5 | Year-6 | Year-7 | Year-8 | Year-9 |
|---|---|---|---|---|---|---|---|---|---|---|
| 1980's | 1,243 | 1,140 | 1,252 | 1,267 | ||||||
| 1990's | 1,403 | 1,264 | 1,610 | 1,020 | 1,078 | 1,074 | 925 | 1,173 | 1,063 | 1,087 |
| 2000's | 1,080 | 765 | 676 | 516 | 644 | 665 | 779 | 556 | 467 | 440 |
| 2010's | 491 | 696 | 650 | 796 | 678 | 676 | 798 | 664 | 641 | 743 |
| 2020's | 563 | 438 | 430 | 572 |
| - = No Data Reported; -- = Not Applicable; NA = Not Available; W = Withheld to avoid disclosure of individual company data. |
| Release Date: 3/29/2024 |
| Next Release Date: 8/30/2024 |