|
Download Data (XLS File) |
|
||||||||
|
||||||||
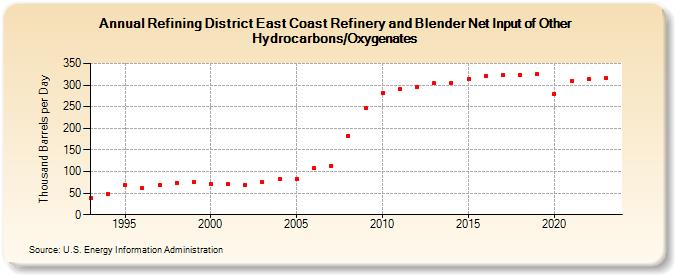
| Refining District East Coast Refinery and Blender Net Input of Other Hydrocarbons/Oxygenates (Thousand Barrels per Day) | ||||||||
| Decade | Year-0 | Year-1 | Year-2 | Year-3 | Year-4 | Year-5 | Year-6 | Year-7 | Year-8 | Year-9 |
|---|---|---|---|---|---|---|---|---|---|---|
| 1990's | 38 | 48 | 69 | 61 | 68 | 74 | 76 | |||
| 2000's | 70 | 71 | 69 | 76 | 82 | 82 | 108 | 113 | 183 | 248 |
| 2010's | 282 | 290 | 296 | 304 | 305 | 313 | 322 | 323 | 323 | 325 |
| 2020's | 280 | 309 | 313 | 317 |
| - = No Data Reported; -- = Not Applicable; NA = Not Available; W = Withheld to avoid disclosure of individual company data. |
| Release Date: 6/28/2024 |
| Next Release Date: 8/30/2024 |