|
Download Data (XLS File) |
|
||||||||
|
||||||||
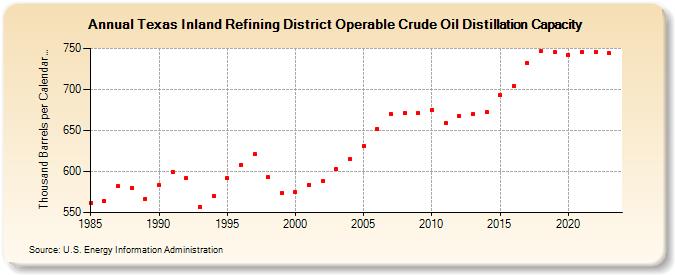
| Texas Inland Refining District Operable Crude Oil Distillation Capacity (Thousand Barrels per Calendar Day) | ||||||||
| Decade | Year-0 | Year-1 | Year-2 | Year-3 | Year-4 | Year-5 | Year-6 | Year-7 | Year-8 | Year-9 |
|---|---|---|---|---|---|---|---|---|---|---|
| 1980's | 562 | 564 | 582 | 580 | 567 | |||||
| 1990's | 583 | 600 | 592 | 557 | 570 | 592 | 608 | 621 | 593 | 574 |
| 2000's | 575 | 584 | 588 | 603 | 615 | 631 | 652 | 670 | 671 | 671 |
| 2010's | 675 | 659 | 668 | 670 | 672 | 693 | 704 | 732 | 747 | 745 |
| 2020's | 742 | 746 | 746 | 744 |
| - = No Data Reported; -- = Not Applicable; NA = Not Available; W = Withheld to avoid disclosure of individual company data. |
| Release Date: 8/30/2024 |
| Next Release Date: 8/29/2025 |
Referring Pages: