|
Download Data (XLS File) |
|
||||||||
|
||||||||
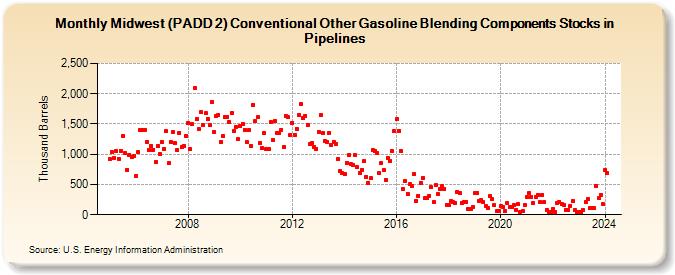
| Midwest (PADD 2) Conventional Other Gasoline Blending Components Stocks in Pipelines (Thousand Barrels) | ||||||||
| Year | Jan | Feb | Mar | Apr | May | Jun | Jul | Aug | Sep | Oct | Nov | Dec |
|---|---|---|---|---|---|---|---|---|---|---|---|---|
| 2005 | 916 | 1,030 | 942 | 1,045 | 928 | 1,060 | 1,309 | 1,023 | 746 | 988 | 948 | 965 |
| 2006 | 645 | 1,035 | 1,406 | 1,404 | 1,405 | 1,208 | 1,062 | 1,138 | 1,077 | 876 | 1,138 | 1,003 |
| 2007 | 1,199 | 1,093 | 1,380 | 849 | 1,202 | 1,371 | 1,182 | 1,071 | 1,356 | 1,114 | 1,142 | 1,307 |
| 2008 | 1,518 | 1,082 | 1,493 | 2,097 | 1,580 | 1,414 | 1,691 | 1,482 | 1,674 | 1,587 | 1,477 | 1,867 |
| 2009 | 1,371 | 1,632 | 1,651 | 1,207 | 1,298 | 1,623 | 1,620 | 1,532 | 1,678 | 1,382 | 1,452 | 1,250 |
| 2010 | 1,464 | 1,499 | 1,397 | 1,198 | 1,399 | 1,141 | 1,821 | 1,549 | 1,614 | 1,188 | 1,101 | 1,353 |
| 2011 | 1,087 | 1,088 | 1,531 | 1,232 | 1,549 | 1,352 | 1,357 | 1,407 | 1,123 | 1,633 | 1,613 | 1,320 |
| 2012 | 1,521 | 1,318 | 1,422 | 1,648 | 1,823 | 1,598 | 1,638 | 1,476 | 1,168 | 1,178 | 1,127 | 1,091 |
| 2013 | 1,369 | 1,645 | 1,346 | 1,216 | 1,208 | 1,349 | 1,158 | 1,210 | 1,173 | 924 | 723 | 688 |
| 2014 | 668 | 860 | 985 | 837 | 829 | 982 | 781 | 690 | 745 | 881 | 629 | 526 |
| 2015 | 599 | 1,072 | 1,053 | 1,028 | 684 | 852 | 746 | 575 | 934 | 894 | 1,053 | 1,377 |
| 2016 | 1,574 | 1,390 | 1,051 | 425 | 555 | 348 | 502 | 472 | 670 | 233 | 316 | 524 |
| 2017 | 612 | 272 | 280 | 316 | 450 | 208 | 493 | 340 | 417 | 476 | 433 | 167 |
| 2018 | 156 | 226 | 213 | 192 | 381 | 364 | 201 | 214 | 218 | 91 | 87 | 127 |
| 2019 | 351 | 355 | 227 | 242 | 204 | 148 | 112 | 307 | 255 | 153 | 55 | 55 |
| 2020 | 144 | 131 | 55 | 189 | 124 | 133 | 164 | 86 | 170 | 52 | 59 | 161 |
| 2021 | 293 | 352 | 298 | 196 | 294 | 329 | 202 | 330 | 207 | 81 | 49 | 48 |
| 2022 | 97 | 47 | 189 | 218 | 172 | 167 | 79 | 79 | 150 | 229 | 76 | 41 |
| 2023 | 42 | 42 | 74 | 212 | 255 | 110 | 111 | 103 | 482 | 273 | 326 | 170 |
| 2024 | 744 | |||||||||||
| - = No Data Reported; -- = Not Applicable; NA = Not Available; W = Withheld to avoid disclosure of individual company data. |
| Release Date: 3/29/2024 |
| Next Release Date: 4/30/2024 |