|
Download Data (XLS File) |
|
||||||||
|
||||||||
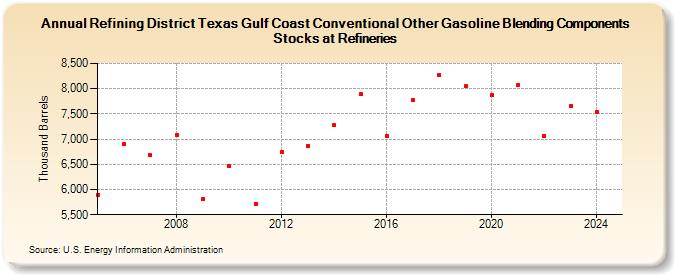
| Refining District Texas Gulf Coast Conventional Other Gasoline Blending Components Stocks at Refineries (Thousand Barrels) | ||||||||
| Decade | Year-0 | Year-1 | Year-2 | Year-3 | Year-4 | Year-5 | Year-6 | Year-7 | Year-8 | Year-9 |
|---|---|---|---|---|---|---|---|---|---|---|
| 2000's | 5,896 | 6,902 | 6,681 | 7,087 | 5,817 | |||||
| 2010's | 6,458 | 5,710 | 6,739 | 6,873 | 7,271 | 7,888 | 7,052 | 7,767 | 8,263 | 8,044 |
| 2020's | 7,865 | 8,073 | 7,066 | 7,655 |
| - = No Data Reported; -- = Not Applicable; NA = Not Available; W = Withheld to avoid disclosure of individual company data. |
| Release Date: 8/30/2024 |
| Next Release Date: 8/29/2025 |