|
Download Data (XLS File) |
|
||||||||
|
||||||||
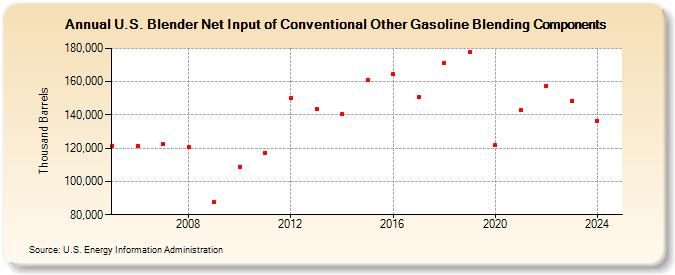
| U.S. Blender Net Input of Conventional Other Gasoline Blending Components (Thousand Barrels) | ||||||||
| Decade | Year-0 | Year-1 | Year-2 | Year-3 | Year-4 | Year-5 | Year-6 | Year-7 | Year-8 | Year-9 |
|---|---|---|---|---|---|---|---|---|---|---|
| 2000's | 121,171 | 121,331 | 122,429 | 120,951 | 87,383 | |||||
| 2010's | 108,911 | 117,271 | 150,131 | 143,500 | 140,550 | 160,956 | 164,308 | 150,750 | 171,004 | 177,722 |
| 2020's | 121,752 | 142,947 | 157,645 | 148,668 | 136,606 |
| - = No Data Reported; -- = Not Applicable; NA = Not Available; W = Withheld to avoid disclosure of individual company data. |
| Release Date: 6/30/2025 |
| Next Release Date: 8/29/2025 |