|
Download Data (XLS File) |
|
||||||||
|
||||||||
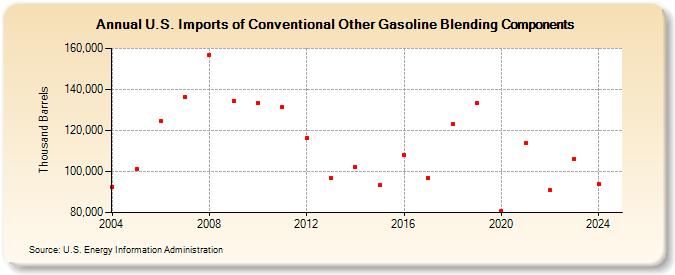
| U.S. Imports of Conventional Other Gasoline Blending Components (Thousand Barrels) | ||||||||
| Decade | Year-0 | Year-1 | Year-2 | Year-3 | Year-4 | Year-5 | Year-6 | Year-7 | Year-8 | Year-9 |
|---|---|---|---|---|---|---|---|---|---|---|
| 2000's | 92,610 | 101,244 | 124,704 | 136,283 | 156,729 | 134,469 | ||||
| 2010's | 133,594 | 131,375 | 116,160 | 96,935 | 102,346 | 93,489 | 108,004 | 96,915 | 123,143 | 133,476 |
| 2020's | 80,793 | 113,828 | 90,753 | 105,940 |
| - = No Data Reported; -- = Not Applicable; NA = Not Available; W = Withheld to avoid disclosure of individual company data. |
| Release Date: 3/29/2024 |
| Next Release Date: 8/30/2024 |