|
Download Data (XLS File) |
|
||||||||
|
||||||||
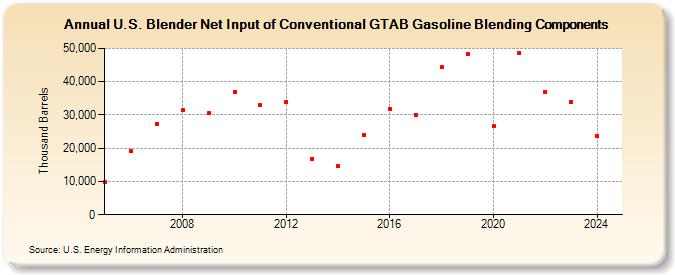
| U.S. Blender Net Input of Conventional GTAB Gasoline Blending Components (Thousand Barrels) | ||||||||
| Decade | Year-0 | Year-1 | Year-2 | Year-3 | Year-4 | Year-5 | Year-6 | Year-7 | Year-8 | Year-9 |
|---|---|---|---|---|---|---|---|---|---|---|
| 2000's | 9,692 | 19,128 | 27,208 | 31,455 | 30,435 | |||||
| 2010's | 36,989 | 32,973 | 33,919 | 16,805 | 14,686 | 23,858 | 31,769 | 30,035 | 44,298 | 48,258 |
| 2020's | 26,736 | 48,476 | 36,893 | 33,830 | 23,785 |
| - = No Data Reported; -- = Not Applicable; NA = Not Available; W = Withheld to avoid disclosure of individual company data. |
| Release Date: 6/30/2025 |
| Next Release Date: 8/29/2025 |