|
Download Data (XLS File) |
|
||||||||
|
||||||||
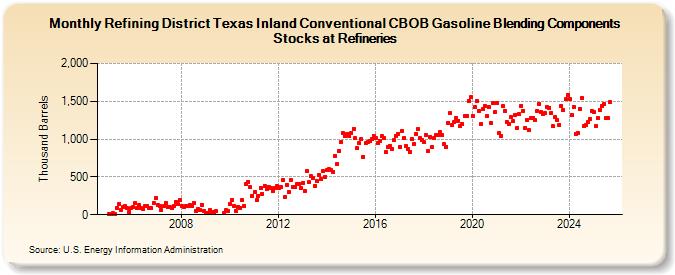
| Refining District Texas Inland Conventional CBOB Gasoline Blending Components Stocks at Refineries (Thousand Barrels) | ||||||||
| Year | Jan | Feb | Mar | Apr | May | Jun | Jul | Aug | Sep | Oct | Nov | Dec |
|---|---|---|---|---|---|---|---|---|---|---|---|---|
| 2005 | 6 | 8 | 19 | 4 | 92 | 145 | 68 | 102 | 110 | 83 | 42 | 83 |
| 2006 | 99 | 153 | 89 | 122 | 83 | 75 | 115 | 115 | 83 | 83 | 157 | 224 |
| 2007 | 123 | 118 | 57 | 109 | 160 | 96 | 108 | 87 | 117 | 170 | 138 | 192 |
| 2008 | 118 | 106 | 116 | 115 | 135 | 111 | 153 | 52 | 77 | 57 | 135 | 48 |
| 2009 | 27 | 17 | 58 | 32 | 37 | 45 | 27 | 58 | 47 | |||
| 2010 | 147 | 192 | 116 | 45 | 106 | 95 | 193 | 120 | 411 | 439 | 366 | 251 |
| 2011 | 296 | 189 | 253 | 354 | 279 | 384 | 343 | 369 | 350 | 316 | 357 | 377 |
| 2012 | 356 | 372 | 454 | 236 | 397 | 300 | 463 | 368 | 365 | 407 | 408 | 356 |
| 2013 | 426 | 311 | 574 | 427 | 507 | 480 | 385 | 440 | 526 | 469 | 577 | 502 |
| 2014 | 585 | 600 | 586 | 571 | 774 | 668 | 847 | 967 | 1,075 | 1,047 | 1,072 | 1,037 |
| 2015 | 1,086 | 1,138 | 1,009 | 877 | 944 | 998 | 769 | 942 | 961 | 981 | 998 | 1,046 |
| 2016 | 1,017 | 944 | 976 | 1,035 | 1,018 | 828 | 901 | 914 | 871 | 986 | 1,045 | 1,073 |
| 2017 | 899 | 1,111 | 1,017 | 908 | 875 | 830 | 1,002 | 938 | 1,069 | 1,132 | 1,011 | 988 |
| 2018 | 957 | 1,055 | 836 | 1,032 | 890 | 1,014 | 1,049 | 1,048 | 1,096 | 1,050 | 931 | 899 |
| 2019 | 1,219 | 1,344 | 1,188 | 1,229 | 1,283 | 1,244 | 1,172 | 1,198 | 1,303 | 1,305 | 1,505 | 1,552 |
| 2020 | 1,311 | 1,427 | 1,504 | 1,375 | 1,200 | 1,392 | 1,442 | 1,305 | 1,429 | 1,219 | 1,472 | 1,354 |
| 2021 | 1,481 | 1,076 | 1,038 | 1,435 | 1,377 | 1,223 | 1,203 | 1,292 | 1,234 | 1,322 | 1,152 | 1,326 |
| 2022 | 1,444 | 1,373 | 1,147 | 1,257 | 1,116 | 1,273 | 1,285 | 1,246 | 1,378 | 1,470 | 1,356 | 1,327 |
| 2023 | 1,339 | 1,420 | 1,387 | 1,346 | 1,167 | 1,297 | 1,251 | 1,187 | 1,435 | 1,382 | 1,526 | 1,583 |
| 2024 | 1,533 | 1,319 | 1,429 | 1,071 | ||||||||
| - = No Data Reported; -- = Not Applicable; NA = Not Available; W = Withheld to avoid disclosure of individual company data. |
| Release Date: 6/28/2024 |
| Next Release Date: 7/31/2024 |