|
Download Data (XLS File) |
|
||||||||
|
||||||||
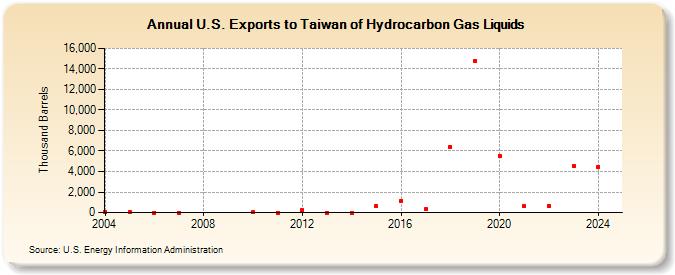
| U.S. Exports to Taiwan of Hydrocarbon Gas Liquids (Thousand Barrels) | ||||||||
| Decade | Year-0 | Year-1 | Year-2 | Year-3 | Year-4 | Year-5 | Year-6 | Year-7 | Year-8 | Year-9 |
|---|---|---|---|---|---|---|---|---|---|---|
| 2000's | 77 | 56 | 0 | 2 | ||||||
| 2010's | 24 | 5 | 263 | 3 | 4 | 592 | 1,173 | 299 | 6,429 | 14,797 |
| 2020's | 5,540 | 593 | 623 | 4,573 |
| - = No Data Reported; -- = Not Applicable; NA = Not Available; W = Withheld to avoid disclosure of individual company data. |
| Release Date: 6/28/2024 |
| Next Release Date: 8/30/2024 |