|
Download Data (XLS File) |
|
||||||||
|
||||||||
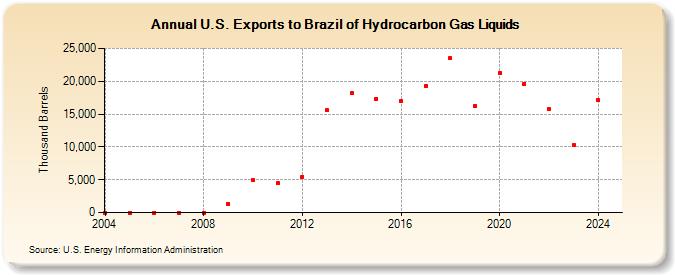
| U.S. Exports to Brazil of Hydrocarbon Gas Liquids (Thousand Barrels) | ||||||||
| Decade | Year-0 | Year-1 | Year-2 | Year-3 | Year-4 | Year-5 | Year-6 | Year-7 | Year-8 | Year-9 |
|---|---|---|---|---|---|---|---|---|---|---|
| 2000's | 2 | 1 | 2 | 3 | 3 | 1,379 | ||||
| 2010's | 4,885 | 4,429 | 5,471 | 15,544 | 18,225 | 17,365 | 16,922 | 19,324 | 23,489 | 16,253 |
| 2020's | 21,220 | 19,631 | 15,708 | 10,340 |
| - = No Data Reported; -- = Not Applicable; NA = Not Available; W = Withheld to avoid disclosure of individual company data. |
| Release Date: 6/28/2024 |
| Next Release Date: 8/30/2024 |