|
Download Data (XLS File) |
|
||||||||
|
||||||||
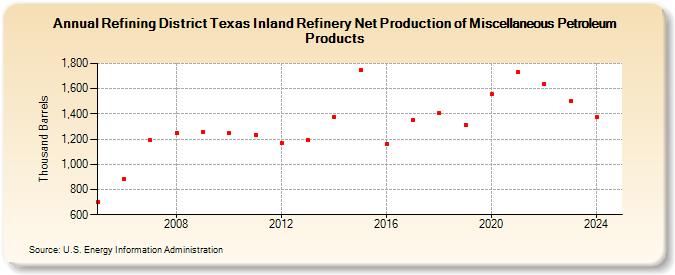
| Refining District Texas Inland Refinery Net Production of Miscellaneous Petroleum Products (Thousand Barrels) | ||||||||
| Decade | Year-0 | Year-1 | Year-2 | Year-3 | Year-4 | Year-5 | Year-6 | Year-7 | Year-8 | Year-9 |
|---|---|---|---|---|---|---|---|---|---|---|
| 2000's | 703 | 887 | 1,189 | 1,251 | 1,258 | |||||
| 2010's | 1,245 | 1,235 | 1,170 | 1,189 | 1,379 | 1,752 | 1,161 | 1,354 | 1,410 | 1,310 |
| 2020's | 1,555 | 1,731 | 1,639 | 1,501 |
| - = No Data Reported; -- = Not Applicable; NA = Not Available; W = Withheld to avoid disclosure of individual company data. |
| Release Date: 6/28/2024 |
| Next Release Date: 8/30/2024 |