|
Download Data (XLS File) |
|
||||||||
|
||||||||
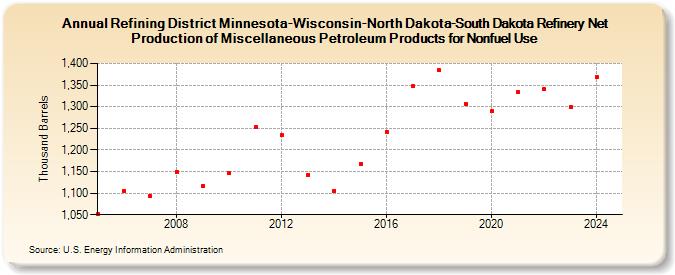
| Refining District Minnesota-Wisconsin-North Dakota-South Dakota Refinery Net Production of Miscellaneous Petroleum Products for Nonfuel Use (Thousand Barrels) | ||||||||
| Decade | Year-0 | Year-1 | Year-2 | Year-3 | Year-4 | Year-5 | Year-6 | Year-7 | Year-8 | Year-9 |
|---|---|---|---|---|---|---|---|---|---|---|
| 2000's | 1,052 | 1,105 | 1,093 | 1,150 | 1,116 | |||||
| 2010's | 1,146 | 1,252 | 1,234 | 1,143 | 1,106 | 1,167 | 1,242 | 1,347 | 1,384 | 1,307 |
| 2020's | 1,289 | 1,333 | 1,340 | 1,299 |
| - = No Data Reported; -- = Not Applicable; NA = Not Available; W = Withheld to avoid disclosure of individual company data. |
| Release Date: 6/28/2024 |
| Next Release Date: 8/30/2024 |