|
Download Data (XLS File) |
|
||||||||
|
||||||||
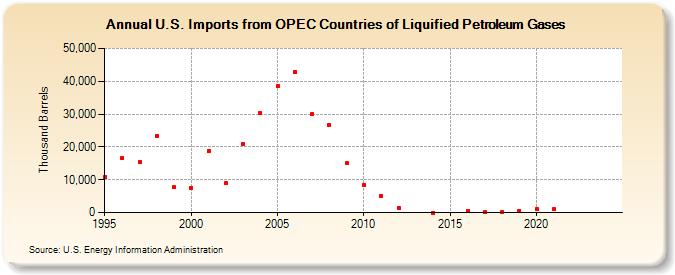
| U.S. Imports from OPEC Countries of Liquified Petroleum Gases (Thousand Barrels) | ||||||||
| Decade | Year-0 | Year-1 | Year-2 | Year-3 | Year-4 | Year-5 | Year-6 | Year-7 | Year-8 | Year-9 |
|---|---|---|---|---|---|---|---|---|---|---|
| 1990's | 10,950 | 16,729 | 15,467 | 23,360 | 7,706 | |||||
| 2000's | 7,507 | 18,729 | 8,883 | 20,949 | 30,328 | 38,399 | 42,875 | 29,985 | 26,584 | 15,010 |
| 2010's | 8,439 | 5,166 | 1,490 | 13 | 577 | 30 | 140 | 497 | ||
| 2020's | 1,160 | 975 | -- | -- |
| - = No Data Reported; -- = Not Applicable; NA = Not Available; W = Withheld to avoid disclosure of individual company data. |
| Release Date: 6/28/2024 |
| Next Release Date: 8/30/2024 |