|
Download Data (XLS File) |
|
||||||||
|
||||||||
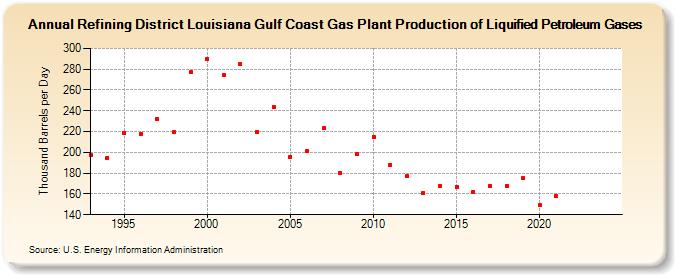
| Refining District Louisiana Gulf Coast Gas Plant Production of Liquified Petroleum Gases (Thousand Barrels per Day) | ||||||||
| Decade | Year-0 | Year-1 | Year-2 | Year-3 | Year-4 | Year-5 | Year-6 | Year-7 | Year-8 | Year-9 |
|---|---|---|---|---|---|---|---|---|---|---|
| 1990's | 197 | 195 | 219 | 218 | 232 | 220 | 277 | |||
| 2000's | 290 | 274 | 285 | 220 | 244 | 196 | 201 | 223 | 180 | 198 |
| 2010's | 215 | 188 | 177 | 161 | 168 | 167 | 162 | 168 | 168 | 175 |
| 2020's | 149 | 158 | -- | -- |
| - = No Data Reported; -- = Not Applicable; NA = Not Available; W = Withheld to avoid disclosure of individual company data. |
| Release Date: 3/29/2024 |
| Next Release Date: 8/30/2024 |