|
Download Data (XLS File) |
|
||||||||
|
||||||||
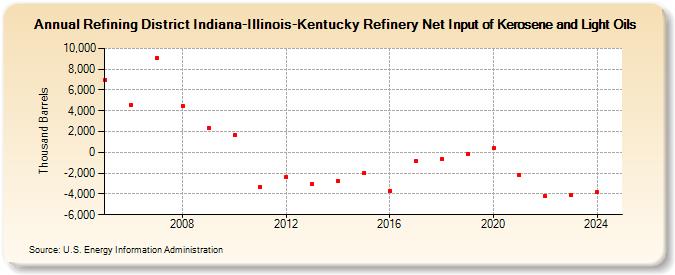
| Refining District Indiana-Illinois-Kentucky Refinery Net Input of Kerosene and Light Oils (Thousand Barrels) | ||||||||
| Decade | Year-0 | Year-1 | Year-2 | Year-3 | Year-4 | Year-5 | Year-6 | Year-7 | Year-8 | Year-9 |
|---|---|---|---|---|---|---|---|---|---|---|
| 2000's | 6,964 | 4,596 | 9,103 | 4,468 | 2,383 | |||||
| 2010's | 1,649 | -3,295 | -2,355 | -3,065 | -2,739 | -2,009 | -3,708 | -814 | -640 | -159 |
| 2020's | 378 | -2,226 | -4,221 | -4,091 |
| - = No Data Reported; -- = Not Applicable; NA = Not Available; W = Withheld to avoid disclosure of individual company data. |
| Release Date: 6/28/2024 |
| Next Release Date: 8/30/2024 |