|
Download Data (XLS File) |
|
||||||||
|
||||||||
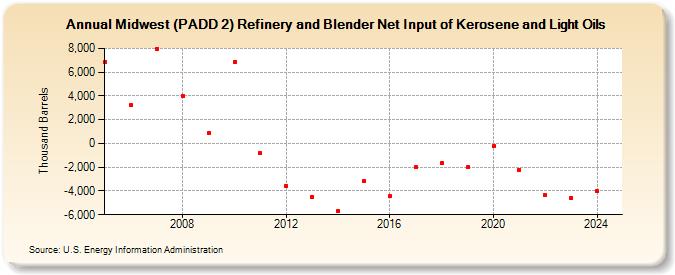
| Midwest (PADD 2) Refinery and Blender Net Input of Kerosene and Light Oils (Thousand Barrels) | ||||||||
| Decade | Year-0 | Year-1 | Year-2 | Year-3 | Year-4 | Year-5 | Year-6 | Year-7 | Year-8 | Year-9 |
|---|---|---|---|---|---|---|---|---|---|---|
| 2000's | 6,839 | 3,215 | 7,951 | 3,976 | 853 | |||||
| 2010's | 6,888 | -818 | -3,578 | -4,468 | -5,692 | -3,202 | -4,450 | -1,988 | -1,659 | -2,019 |
| 2020's | -217 | -2,213 | -4,348 | -4,573 |
| - = No Data Reported; -- = Not Applicable; NA = Not Available; W = Withheld to avoid disclosure of individual company data. |
| Release Date: 8/30/2024 |
| Next Release Date: 8/29/2025 |