|
Download Data (XLS File) |
|
||||||||
|
||||||||
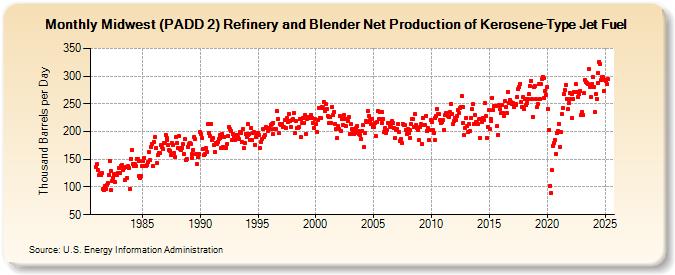
| Midwest (PADD 2) Refinery and Blender Net Production of Kerosene-Type Jet Fuel (Thousand Barrels per Day) | ||||||||
| Year | Jan | Feb | Mar | Apr | May | Jun | Jul | Aug | Sep | Oct | Nov | Dec |
|---|---|---|---|---|---|---|---|---|---|---|---|---|
| 1981 | 136 | 141 | 130 | 121 | 124 | 121 | 125 | 96 | 94 | 102 | 96 | 104 |
| 1982 | 107 | 121 | 147 | 129 | 95 | 111 | 116 | 124 | 109 | 122 | 122 | 125 |
| 1983 | 134 | 125 | 138 | 140 | 130 | 134 | 112 | 136 | 117 | 137 | 134 | 96 |
| 1984 | 151 | 167 | 141 | 137 | 141 | 138 | 151 | 151 | 147 | 120 | 117 | 119 |
| 1985 | 138 | 147 | 153 | 138 | 137 | 139 | 145 | 163 | 148 | 173 | 178 | 137 |
| 1986 | 182 | 190 | 170 | 143 | 157 | 162 | 161 | 175 | 173 | 169 | 179 | 179 |
| 1987 | 194 | 189 | 184 | 175 | 166 | 165 | 158 | 179 | 176 | 162 | 154 | 191 |
| 1988 | 179 | 171 | 192 | 168 | 166 | 171 | 177 | 160 | 186 | 148 | 151 | 173 |
| 1989 | 177 | 180 | 177 | 152 | 159 | 167 | 191 | 186 | 159 | 141 | 154 | 159 |
| 1990 | 199 | 195 | 188 | 169 | 157 | 160 | 170 | 164 | 213 | 198 | 192 | 214 |
| 1991 | 185 | 188 | 176 | 163 | 179 | 178 | 181 | 186 | 193 | 188 | 170 | 196 |
| 1992 | 172 | 191 | 171 | 171 | 178 | 192 | 208 | 204 | 201 | 185 | 196 | 192 |
| 1993 | 185 | 194 | 194 | 190 | 187 | 199 | 197 | 181 | 204 | 170 | 180 | 196 |
| 1994 | 190 | 213 | 193 | 196 | 184 | 207 | 185 | 198 | 199 | 176 | 191 | 193 |
| 1995 | 198 | 193 | 170 | 181 | 187 | 204 | 191 | 194 | 208 | 207 | 201 | 207 |
| 1996 | 204 | 212 | 214 | 195 | 216 | 204 | 205 | 204 | 237 | 223 | 197 | 214 |
| 1997 | 211 | 214 | 209 | 208 | 221 | 206 | 225 | 217 | 232 | 219 | 209 | 220 |
| 1998 | 222 | 234 | 197 | 219 | 206 | 207 | 209 | 222 | 190 | 222 | 216 | 224 |
| 1999 | 215 | 229 | 196 | 223 | 227 | 224 | 225 | 230 | 225 | 216 | 207 | 222 |
| 2000 | 214 | 199 | 221 | 243 | 225 | 224 | 245 | 242 | 253 | 237 | 249 | 240 |
| 2001 | 228 | 226 | 215 | 226 | 215 | 244 | 230 | 236 | 214 | 205 | 188 | 210 |
| 2002 | 204 | 228 | 201 | 222 | 212 | 230 | 223 | 210 | 223 | 219 | 226 | 196 |
| 2003 | 213 | 204 | 200 | 196 | 205 | 198 | 207 | 210 | 201 | 195 | 194 | 187 |
| 2004 | 201 | 211 | 172 | 197 | 219 | 217 | 237 | 228 | 221 | 213 | 223 | 208 |
| 2005 | 209 | 216 | 192 | 217 | 237 | 222 | 235 | 222 | 216 | 235 | 223 | 200 |
| 2006 | 207 | 198 | 203 | 216 | 216 | 210 | 209 | 219 | 215 | 207 | 188 | 202 |
| 2007 | 204 | 214 | 200 | 183 | 186 | 179 | 214 | 211 | 211 | 203 | 196 | 204 |
| 2008 | 198 | 203 | 189 | 213 | 222 | 222 | 209 | 231 | 212 | 206 | 203 | 185 |
| 2009 | 208 | 213 | 178 | 225 | 212 | 212 | 228 | 201 | 207 | 185 | 202 | 221 |
| 2010 | 218 | 202 | 198 | 184 | 224 | 228 | 241 | 232 | 231 | 220 | 216 | 217 |
| 2011 | 220 | 203 | 229 | 233 | 234 | 228 | 227 | 235 | 250 | 232 | 213 | 219 |
| 2012 | 225 | 221 | 228 | 238 | 234 | 242 | 244 | 264 | 244 | 216 | 193 | 207 |
| 2013 | 225 | 210 | 199 | 214 | 201 | 225 | 240 | 249 | 213 | 229 | 217 | 215 |
| 2014 | 214 | 222 | 189 | 223 | 217 | 224 | 220 | 251 | 228 | 189 | 209 | 238 |
| 2015 | 204 | 223 | 219 | 261 | 239 | 246 | 246 | 246 | 210 | 194 | 247 | 240 |
| 2016 | 233 | 247 | 233 | 228 | 255 | 244 | 234 | 271 | 252 | 257 | 254 | 249 |
| 2017 | 251 | 244 | 250 | 248 | 250 | 263 | 276 | 280 | 286 | 253 | 245 | 262 |
| 2018 | 240 | 259 | 247 | 252 | 258 | 267 | 283 | 292 | 258 | 227 | 280 | 283 |
| 2019 | 259 | 244 | 250 | 285 | 258 | 285 | 295 | 299 | 296 | 261 | 274 | 266 |
| 2020 | 280 | 241 | 203 | 102 | 89 | 130 | 174 | 179 | 185 | 159 | 197 | 201 |
| 2021 | 214 | 173 | 200 | 231 | 243 | 267 | 275 | 284 | 259 | 240 | 251 | 270 |
| 2022 | 259 | 268 | 224 | 259 | 271 | 272 | 285 | 272 | 262 | 267 | 274 | 229 |
| 2023 | 236 | 229 | 269 | 293 | 289 | 288 | 285 | 312 | 280 | 262 | 285 | 299 |
| 2024 | 280 | 236 | 267 | 259 | ||||||||
| - = No Data Reported; -- = Not Applicable; NA = Not Available; W = Withheld to avoid disclosure of individual company data. |
| Release Date: 6/28/2024 |
| Next Release Date: 7/31/2024 |