|
Download Data (XLS File) |
|
||||||||
|
||||||||
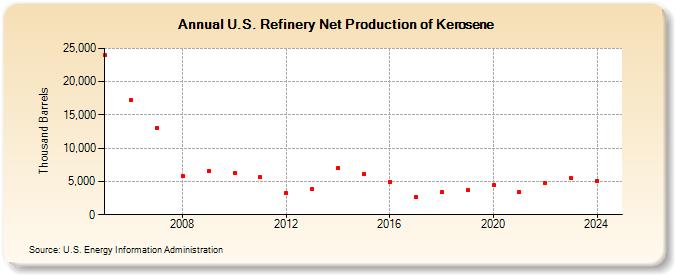
| U.S. Refinery Net Production of Kerosene (Thousand Barrels) | ||||||||
| Decade | Year-0 | Year-1 | Year-2 | Year-3 | Year-4 | Year-5 | Year-6 | Year-7 | Year-8 | Year-9 |
|---|---|---|---|---|---|---|---|---|---|---|
| 2000's | 23,933 | 17,306 | 13,034 | 5,796 | 6,509 | |||||
| 2010's | 6,222 | 5,629 | 3,249 | 3,798 | 7,058 | 6,164 | 4,992 | 2,591 | 3,357 | 3,655 |
| 2020's | 4,410 | 3,419 | 4,783 | 5,249 |
| - = No Data Reported; -- = Not Applicable; NA = Not Available; W = Withheld to avoid disclosure of individual company data. |
| Release Date: 6/28/2024 |
| Next Release Date: 8/30/2024 |
Referring Pages: