|
Download Data (XLS File) |
|
||||||||
|
||||||||
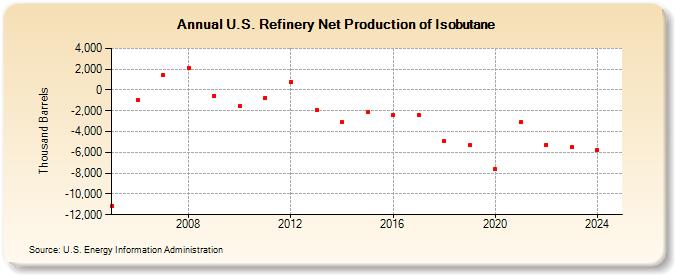
| U.S. Refinery Net Production of Isobutane (Thousand Barrels) | ||||||||
| Decade | Year-0 | Year-1 | Year-2 | Year-3 | Year-4 | Year-5 | Year-6 | Year-7 | Year-8 | Year-9 |
|---|---|---|---|---|---|---|---|---|---|---|
| 2000's | -11,133 | -926 | 1,462 | 2,068 | -552 | |||||
| 2010's | -1,515 | -746 | 773 | -1,882 | -3,090 | -2,152 | -2,447 | -2,362 | -4,940 | -5,330 |
| 2020's | -7,629 | -3,090 | -5,247 | -5,510 |
| - = No Data Reported; -- = Not Applicable; NA = Not Available; W = Withheld to avoid disclosure of individual company data. |
| Release Date: 6/28/2024 |
| Next Release Date: 8/30/2024 |
Referring Pages: