|
Download Data (XLS File) |
|
||||||||
|
||||||||
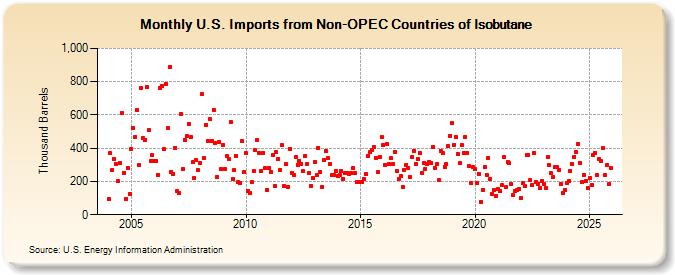
| U.S. Imports from Non-OPEC Countries of Isobutane (Thousand Barrels) | ||||||||
| Year | Jan | Feb | Mar | Apr | May | Jun | Jul | Aug | Sep | Oct | Nov | Dec |
|---|---|---|---|---|---|---|---|---|---|---|---|---|
| 2004 | 97 | 369 | 269 | 337 | 307 | 200 | 310 | 611 | 252 | 97 | 283 | 126 |
| 2005 | 398 | 522 | 469 | 632 | 300 | 763 | 464 | 451 | 769 | 507 | 321 | 357 |
| 2006 | 322 | 324 | 240 | 762 | 776 | 394 | 786 | 521 | 889 | 257 | 246 | 403 |
| 2007 | 140 | 128 | 606 | 276 | 449 | 472 | 547 | 465 | 315 | 221 | 326 | 266 |
| 2008 | 310 | 725 | 341 | 542 | 442 | 575 | 445 | 632 | 431 | 228 | 437 | 277 |
| 2009 | 421 | 276 | 351 | 335 | 557 | 212 | 268 | 352 | 197 | 192 | 441 | 258 |
| 2010 | 371 | 140 | 130 | 194 | 265 | 388 | 448 | 370 | 260 | 373 | 279 | 150 |
| 2011 | 279 | 259 | 360 | 171 | 375 | 337 | 271 | 417 | 174 | 304 | 167 | 397 |
| 2012 | 252 | 241 | 349 | 301 | 325 | 307 | 261 | 354 | 304 | 248 | 175 | 223 |
| 2013 | 317 | 236 | 403 | 256 | 167 | 330 | 381 | 339 | 303 | 240 | 240 | 263 |
| 2014 | 232 | 236 | 261 | 217 | 250 | 252 | 247 | 250 | 279 | 253 | 197 | 195 |
| 2015 | 194 | 198 | 214 | 244 | 355 | 375 | 387 | 405 | 342 | 254 | 347 | 466 |
| 2016 | 418 | 298 | 423 | 306 | 339 | 305 | 380 | 262 | 213 | 231 | 169 | 271 |
| 2017 | 301 | 283 | 228 | 345 | 386 | 307 | 336 | 373 | 253 | 312 | 275 | 306 |
| 2018 | 317 | 313 | 409 | 280 | 305 | 207 | 385 | 372 | 289 | 306 | 412 | 474 |
| 2019 | 550 | 421 | 467 | 367 | 310 | 420 | 372 | 470 | 372 | 292 | 191 | 284 |
| 2020 | 272 | 188 | 245 | 77 | 149 | 287 | 241 | 341 | 216 | 127 | 149 | 114 |
| 2021 | 153 | 141 | 176 | 347 | 167 | 318 | 309 | 186 | 117 | 142 | 147 | 155 |
| 2022 | 99 | 191 | 170 | 359 | 357 | 206 | 179 | 373 | 195 | 184 | 163 | 203 |
| 2023 | 183 | 162 | 347 | 297 | 239 | 218 | 277 | 286 | 269 | 183 | 133 | 149 |
| 2024 | 193 | 201 | 234 | 303 | ||||||||
| - = No Data Reported; -- = Not Applicable; NA = Not Available; W = Withheld to avoid disclosure of individual company data. |
| Release Date: 6/28/2024 |
| Next Release Date: 7/31/2024 |