|
Download Data (XLS File) |
|
||||||||
|
||||||||
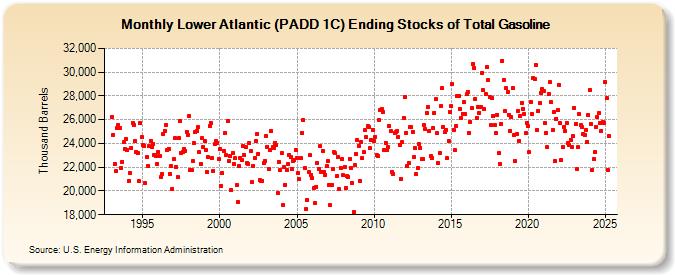
| Lower Atlantic (PADD 1C) Ending Stocks of Total Gasoline (Thousand Barrels) | ||||||||
| Year | Jan | Feb | Mar | Apr | May | Jun | Jul | Aug | Sep | Oct | Nov | Dec |
|---|---|---|---|---|---|---|---|---|---|---|---|---|
| 1993 | 26,240 | 24,737 | 22,295 | 21,640 | 25,268 | 25,536 | 25,293 | 21,933 | 22,468 | 24,083 | 23,564 | 24,393 |
| 1994 | 23,442 | 20,843 | 21,516 | 23,628 | 25,704 | 25,577 | 24,225 | 23,262 | 23,158 | 20,797 | 25,728 | 24,540 |
| 1995 | 23,859 | 23,808 | 20,690 | 22,878 | 22,142 | 23,785 | 24,233 | 23,730 | 23,990 | 23,036 | 22,984 | 22,291 |
| 1996 | 23,284 | 22,945 | 21,167 | 21,437 | 24,793 | 25,054 | 25,572 | 23,459 | 23,562 | 21,462 | 22,085 | 20,202 |
| 1997 | 22,687 | 24,436 | 22,045 | 21,139 | 24,420 | 25,850 | 23,216 | 23,317 | 23,537 | 23,364 | 24,972 | 24,744 |
| 1998 | 26,322 | 21,725 | 21,779 | 22,522 | 23,998 | 24,964 | 25,074 | 25,360 | 23,251 | 22,290 | 24,423 | 23,719 |
| 1999 | 24,173 | 23,428 | 21,569 | 22,818 | 25,479 | 25,726 | 22,753 | 21,681 | 23,941 | 24,166 | 24,064 | 22,659 |
| 2000 | 23,510 | 20,420 | 21,492 | 23,359 | 24,866 | 22,986 | 25,904 | 22,511 | 22,976 | 20,062 | 23,217 | 22,241 |
| 2001 | 22,751 | 20,495 | 19,086 | 22,127 | 22,811 | 22,572 | 23,781 | 23,007 | 23,659 | 22,359 | 22,292 | 24,052 |
| 2002 | 23,376 | 20,717 | 22,107 | 22,784 | 24,165 | 24,818 | 23,141 | 20,902 | 20,879 | 20,866 | 22,371 | 22,562 |
| 2003 | 24,632 | 23,724 | 21,852 | 23,448 | 25,026 | 23,665 | 23,620 | 24,074 | 23,852 | 19,791 | 22,479 | 21,753 |
| 2004 | 23,171 | 18,787 | 22,005 | 20,533 | 21,763 | 22,275 | 23,034 | 22,828 | 21,877 | 22,483 | 22,586 | 23,472 |
| 2005 | 22,781 | 21,507 | 20,981 | 22,768 | 24,914 | 25,950 | 21,949 | 18,477 | 19,246 | 21,555 | 23,004 | 21,369 |
| 2006 | 21,075 | 20,252 | 19,014 | 20,357 | 22,360 | 21,825 | 23,752 | 21,619 | 23,387 | 21,589 | 21,360 | 22,100 |
| 2007 | 22,493 | 20,469 | 18,783 | 20,538 | 21,815 | 23,271 | 23,159 | 21,220 | 22,877 | 20,131 | 21,963 | 22,680 |
| 2008 | 21,304 | 22,041 | 20,261 | 21,292 | 21,182 | 22,713 | 21,940 | 20,678 | 18,227 | 22,154 | 23,101 | 24,282 |
| 2009 | 23,795 | 20,824 | 24,113 | 22,770 | 23,263 | 25,130 | 24,529 | 25,458 | 25,364 | 23,595 | 24,293 | 25,163 |
| 2010 | 24,200 | 24,565 | 23,037 | 22,928 | 25,974 | 26,794 | 26,871 | 26,669 | 23,422 | 24,074 | 23,412 | 23,664 |
| 2011 | 25,453 | 25,013 | 21,630 | 21,450 | 24,873 | 24,921 | 25,055 | 24,555 | 23,859 | 21,033 | 24,114 | 26,132 |
| 2012 | 27,918 | 24,883 | 22,068 | 22,335 | 25,368 | 25,354 | 24,992 | 22,838 | 23,590 | 21,407 | 21,922 | 23,933 |
| 2013 | 23,627 | 22,668 | 22,693 | 25,565 | 25,228 | 26,586 | 27,080 | 25,050 | 22,916 | 22,796 | 25,303 | 26,591 |
| 2014 | 27,701 | 24,839 | 22,353 | 23,210 | 27,132 | 28,632 | 25,421 | 24,960 | 25,161 | 22,750 | 24,220 | 26,671 |
| 2015 | 27,145 | 28,988 | 25,142 | 23,420 | 25,484 | 28,029 | 27,974 | 26,913 | 26,160 | 26,515 | 27,487 | 26,474 |
| 2016 | 28,131 | 28,357 | 24,903 | 25,801 | 26,947 | 30,701 | 30,353 | 27,755 | 26,159 | 27,083 | 26,576 | 27,098 |
| 2017 | 29,958 | 28,472 | 26,892 | 28,138 | 30,399 | 29,326 | 27,947 | 25,546 | 27,809 | 26,295 | 25,538 | 24,864 |
| 2018 | 26,429 | 23,164 | 22,286 | 25,672 | 30,948 | 29,362 | 26,730 | 28,632 | 28,335 | 26,411 | 25,063 | 26,191 |
| 2019 | 28,657 | 24,737 | 22,522 | 24,798 | 26,746 | 24,196 | 26,326 | 27,438 | 26,924 | 26,458 | 24,849 | 25,751 |
| 2020 | 25,434 | 23,250 | 27,487 | 26,470 | 29,494 | 29,383 | 30,612 | 25,115 | 26,766 | 27,389 | 28,225 | 28,563 |
| 2021 | 28,442 | 25,691 | 24,916 | 23,661 | 28,147 | 29,132 | 27,475 | 25,139 | 26,655 | 22,504 | 26,060 | 26,789 |
| 2022 | 28,921 | 25,683 | 22,598 | 23,714 | 25,414 | 25,027 | 25,722 | 24,020 | 23,831 | 24,328 | 23,721 | 24,611 |
| 2023 | 27,007 | 25,674 | 21,849 | 23,678 | 26,436 | 25,525 | 25,350 | 24,792 | 24,675 | 25,157 | 24,162 | 26,402 |
| 2024 | 28,515 | 25,616 | 21,793 | 22,679 | 23,318 | 25,390 | ||||||
| - = No Data Reported; -- = Not Applicable; NA = Not Available; W = Withheld to avoid disclosure of individual company data. |
| Release Date: 8/30/2024 |
| Next Release Date: 9/30/2024 |