|
Download Data (XLS File) |
|
||||||||
|
||||||||
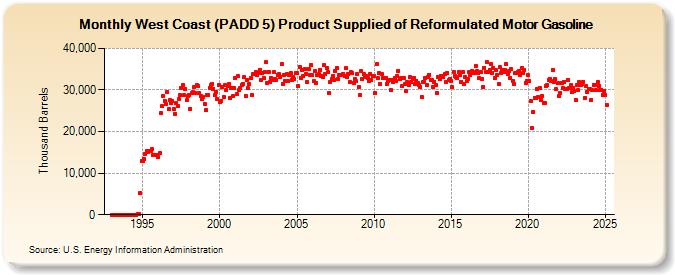
| West Coast (PADD 5) Product Supplied of Reformulated Motor Gasoline (Thousand Barrels) | ||||||||
| Year | Jan | Feb | Mar | Apr | May | Jun | Jul | Aug | Sep | Oct | Nov | Dec |
|---|---|---|---|---|---|---|---|---|---|---|---|---|
| 1993 | 0 | 0 | 0 | 0 | 0 | 0 | 0 | 0 | 0 | 0 | 0 | 0 |
| 1994 | 0 | 0 | 0 | 0 | 0 | 0 | 0 | 0 | 189 | 113 | 5,265 | 12,858 |
| 1995 | 13,021 | 13,409 | 14,648 | 15,358 | 15,014 | 15,365 | 15,330 | 15,691 | 14,423 | 14,386 | 14,413 | 14,449 |
| 1996 | 13,977 | 14,751 | 24,343 | 26,058 | 28,590 | 27,423 | 26,517 | 29,501 | 25,416 | 27,617 | 26,773 | 27,402 |
| 1997 | 25,331 | 24,245 | 26,766 | 26,124 | 27,761 | 28,725 | 30,563 | 31,100 | 28,728 | 30,167 | 27,509 | 28,473 |
| 1998 | 28,823 | 25,444 | 29,300 | 29,477 | 30,622 | 29,331 | 31,122 | 30,975 | 29,194 | 28,458 | 27,775 | 28,367 |
| 1999 | 26,690 | 25,121 | 28,857 | 28,903 | 30,570 | 31,085 | 31,462 | 30,305 | 28,680 | 29,606 | 27,801 | 31,145 |
| 2000 | 27,051 | 27,459 | 30,814 | 28,420 | 31,121 | 30,108 | 30,942 | 31,450 | 28,174 | 30,488 | 28,564 | 30,418 |
| 2001 | 32,891 | 28,949 | 33,324 | 29,924 | 30,452 | 31,280 | 31,516 | 33,029 | 28,632 | 32,512 | 30,401 | 31,380 |
| 2002 | 32,875 | 28,844 | 33,914 | 33,943 | 34,296 | 33,628 | 34,095 | 34,906 | 32,377 | 34,139 | 32,867 | 34,421 |
| 2003 | 36,608 | 31,622 | 34,401 | 31,928 | 32,953 | 32,420 | 34,320 | 32,723 | 32,395 | 33,683 | 33,768 | 33,204 |
| 2004 | 36,239 | 31,513 | 33,589 | 32,056 | 33,784 | 32,068 | 33,490 | 34,133 | 32,439 | 33,123 | 32,643 | 34,027 |
| 2005 | 34,007 | 30,951 | 35,600 | 32,875 | 34,887 | 33,324 | 34,989 | 33,913 | 31,866 | 35,011 | 33,599 | 36,072 |
| 2006 | 33,511 | 32,095 | 34,451 | 31,777 | 33,665 | 33,778 | 34,872 | 33,480 | 33,128 | 35,949 | 33,884 | 35,352 |
| 2007 | 34,296 | 29,232 | 31,843 | 32,592 | 33,426 | 32,478 | 34,669 | 35,341 | 32,722 | 33,673 | 33,694 | 33,495 |
| 2008 | 33,889 | 33,394 | 35,213 | 33,197 | 33,844 | 32,022 | 34,202 | 34,032 | 31,790 | 32,728 | 32,110 | 33,751 |
| 2009 | 30,599 | 28,840 | 34,492 | 32,708 | 33,809 | 33,221 | 33,407 | 32,920 | 32,274 | 33,925 | 32,492 | 33,436 |
| 2010 | 33,440 | 29,326 | 36,139 | 32,785 | 34,129 | 31,492 | 33,733 | 32,949 | 32,885 | 32,806 | 31,469 | 32,162 |
| 2011 | 32,289 | 29,899 | 32,499 | 32,016 | 32,945 | 32,257 | 33,298 | 34,652 | 32,736 | 32,899 | 30,932 | 32,761 |
| 2012 | 31,361 | 29,664 | 31,819 | 31,150 | 33,006 | 32,003 | 32,557 | 32,952 | 31,437 | 32,246 | 31,659 | 31,266 |
| 2013 | 30,598 | 28,324 | 31,970 | 31,988 | 32,927 | 31,253 | 33,059 | 33,703 | 32,303 | 32,370 | 30,714 | 32,011 |
| 2014 | 31,241 | 29,375 | 33,221 | 32,567 | 33,417 | 33,309 | 33,124 | 33,737 | 31,974 | 34,187 | 32,323 | 32,749 |
| 2015 | 32,240 | 30,612 | 34,409 | 33,456 | 33,062 | 32,872 | 34,365 | 33,615 | 31,989 | 34,294 | 31,454 | 33,073 |
| 2016 | 32,125 | 32,644 | 34,261 | 33,566 | 34,490 | 34,359 | 34,090 | 35,784 | 34,513 | 33,999 | 32,763 | 34,304 |
| 2017 | 32,669 | 30,766 | 35,382 | 34,328 | 36,701 | 34,375 | 34,853 | 36,319 | 34,186 | 35,232 | 32,928 | 34,712 |
| 2018 | 33,678 | 31,455 | 35,454 | 34,130 | 34,779 | 34,317 | 34,815 | 36,241 | 33,931 | 34,678 | 32,923 | 34,940 |
| 2019 | 32,219 | 31,428 | 34,180 | 34,195 | 34,302 | 34,513 | 33,642 | 35,344 | 34,175 | 34,836 | 31,744 | 32,243 |
| 2020 | 33,513 | 32,186 | 27,299 | 20,861 | 24,752 | 28,095 | 28,094 | 30,258 | 28,302 | 30,571 | 27,618 | 28,503 |
| 2021 | 26,911 | 26,777 | 30,978 | 31,164 | 32,483 | 32,718 | 32,185 | 34,870 | 32,033 | 32,585 | 30,173 | 31,714 |
| 2022 | 28,627 | 29,366 | 31,789 | 30,460 | 32,015 | 30,247 | 30,149 | 32,395 | 30,511 | 31,107 | 29,454 | 30,582 |
| 2023 | 29,809 | 27,641 | 31,114 | 30,002 | 31,910 | 31,072 | 31,354 | 31,995 | 28,053 | 31,749 | 29,555 | 30,214 |
| 2024 | 30,142 | 27,667 | 29,910 | 31,208 | ||||||||
| - = No Data Reported; -- = Not Applicable; NA = Not Available; W = Withheld to avoid disclosure of individual company data. |
| Release Date: 6/28/2024 |
| Next Release Date: 7/31/2024 |