|
Download Data (XLS File) |
|
||||||||
|
||||||||
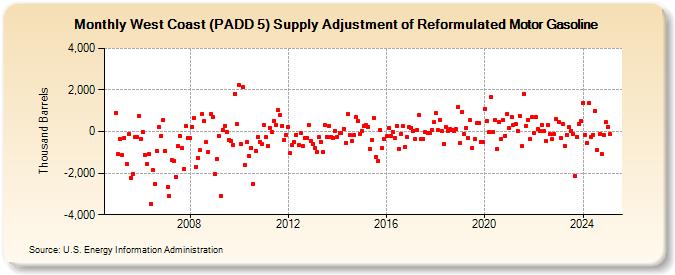
| West Coast (PADD 5) Supply Adjustment of Reformulated Motor Gasoline (Thousand Barrels) | ||||||||
| Year | Jan | Feb | Mar | Apr | May | Jun | Jul | Aug | Sep | Oct | Nov | Dec |
|---|---|---|---|---|---|---|---|---|---|---|---|---|
| 2005 | 913 | -1,081 | -360 | -1,118 | -287 | -1,566 | -137 | -2,219 | -2,041 | -273 | -257 | 755 |
| 2006 | -351 | -36 | -1,114 | -1,551 | -1,079 | -3,467 | -1,864 | -2,502 | -943 | 210 | -195 | 573 |
| 2007 | -917 | -2,658 | -3,101 | -1,389 | -1,437 | -2,183 | -698 | -214 | -776 | -1,822 | 261 | -287 |
| 2008 | -327 | 220 | 671 | -1,686 | -1,262 | -904 | 845 | 503 | -525 | -995 | 843 | 719 |
| 2009 | -2,048 | -1,317 | -200 | -3,089 | 94 | 290 | -26 | -391 | -449 | -628 | 1,820 | 341 |
| 2010 | 2,227 | -618 | 2,120 | -1,598 | -504 | -1,175 | -776 | -2,499 | -933 | -250 | -496 | -576 |
| 2011 | 319 | -268 | -685 | 194 | -27 | 519 | 325 | 1,030 | 774 | 282 | -410 | -165 |
| 2012 | 213 | -1,051 | -665 | -518 | -148 | -652 | -88 | -709 | -324 | -288 | 308 | -443 |
| 2013 | -611 | -782 | -1,006 | -275 | -491 | -1,001 | 338 | -249 | 287 | -260 | -308 | 26 |
| 2014 | -247 | -81 | -56 | 139 | -546 | 826 | -158 | -438 | -186 | 705 | 507 | -119 |
| 2015 | 44 | 244 | 295 | 232 | -822 | -421 | 660 | -1,209 | -1,418 | 67 | -805 | -382 |
| 2016 | -219 | 172 | -210 | -8 | -309 | 261 | -833 | -103 | 266 | -741 | -247 | 202 |
| 2017 | 187 | 47 | -361 | 74 | 809 | -344 | -338 | -40 | -60 | -56 | 79 | 443 |
| 2018 | 880 | 54 | 574 | 15 | -588 | 209 | 41 | 125 | 91 | 11 | 101 | 1,194 |
| 2019 | -561 | 954 | -119 | 192 | -321 | 539 | -788 | -336 | 400 | 424 | -493 | -497 |
| 2020 | 1,104 | 517 | -30 | 1,649 | -29 | 569 | -823 | 454 | -362 | 569 | -196 | 862 |
| 2021 | 152 | 691 | 305 | 375 | 39 | 758 | -708 | 1,821 | 290 | 563 | -368 | 676 |
| 2022 | -76 | 696 | 121 | 26 | 333 | 23 | -468 | 323 | -127 | -364 | -134 | 586 |
| 2023 | 460 | -290 | 366 | -705 | -146 | 200 | 45 | -139 | -2,155 | -239 | 358 | 497 |
| 2024 | 1,372 | -147 | -534 | 1,364 | -241 | -142 | 993 | -866 | -123 | -1,058 | -151 | 439 |
| 2025 | 214 | -141 | -970 | 3 | ||||||||
| - = No Data Reported; -- = Not Applicable; NA = Not Available; W = Withheld to avoid disclosure of individual company data. |
| Release Date: 6/30/2025 |
| Next Release Date: 7/31/2025 |