|
Download Data (XLS File) |
|
||||||||
|
||||||||
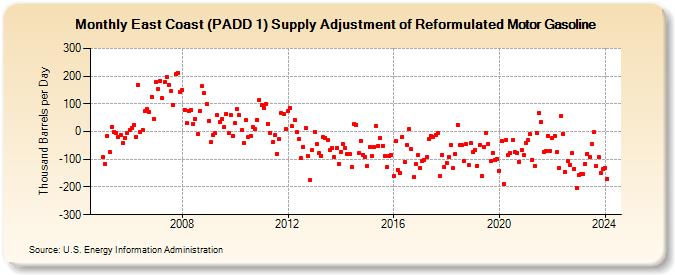
| East Coast (PADD 1) Supply Adjustment of Reformulated Motor Gasoline (Thousand Barrels per Day) | ||||||||
| Year | Jan | Feb | Mar | Apr | May | Jun | Jul | Aug | Sep | Oct | Nov | Dec |
|---|---|---|---|---|---|---|---|---|---|---|---|---|
| 2005 | -92 | -118 | -16 | -75 | 18 | 0 | -4 | -20 | -13 | -43 | -22 | -4 |
| 2006 | 5 | 12 | 25 | -19 | 169 | -1 | 6 | 74 | 81 | 70 | 126 | 47 |
| 2007 | 179 | 154 | 182 | 120 | 178 | 197 | 168 | 148 | 97 | 206 | 213 | 142 |
| 2008 | 150 | 79 | 30 | 75 | 78 | 27 | 47 | -10 | 74 | 163 | 139 | 101 |
| 2009 | 39 | -39 | -11 | -4 | 58 | 36 | 45 | 15 | 64 | -6 | 58 | -16 |
| 2010 | 30 | 81 | 58 | 4 | -43 | 43 | -21 | -15 | 17 | 9 | 42 | 115 |
| 2011 | 94 | 84 | 100 | 29 | -5 | -39 | -14 | -80 | -28 | 66 | 62 | 9 |
| 2012 | 73 | 86 | 19 | 43 | -3 | -26 | -97 | -57 | 14 | -87 | -176 | -67 |
| 2013 | -2 | -45 | -79 | -87 | -21 | -22 | -32 | -68 | -58 | -92 | -58 | -117 |
| 2014 | -72 | -46 | -59 | -82 | -82 | -128 | 29 | 24 | -79 | -33 | -83 | -91 |
| 2015 | -124 | -54 | -88 | -56 | 20 | -51 | -22 | -51 | -87 | -129 | -89 | -83 |
| 2016 | -160 | -35 | -139 | -149 | -19 | -111 | -47 | 10 | -64 | -164 | -118 | -85 |
| 2017 | -131 | -108 | -103 | -92 | -28 | -16 | -18 | -12 | -7 | -161 | -85 | -129 |
| 2018 | -112 | -92 | -50 | -133 | -80 | 24 | -49 | -50 | -106 | -45 | -121 | -43 |
| 2019 | -73 | -67 | -123 | -48 | -160 | -57 | -4 | -44 | -107 | -76 | -101 | -99 |
| 2020 | -141 | -33 | -189 | -30 | -84 | -78 | -31 | -75 | -77 | -109 | -67 | -84 |
| 2021 | -40 | -31 | -10 | -101 | -123 | -5 | 66 | 34 | -72 | -70 | -15 | -69 |
| 2022 | -25 | -16 | -75 | -133 | 56 | -8 | -146 | -106 | -122 | -79 | -134 | -202 |
| 2023 | -115 | -138 | -168 | -113 | -75 | -88 | -46 | -3 | -124 | -92 | -151 | -137 |
| 2024 | -130 | -172 | -129 | -123 | -58 | -59 | ||||||
| - = No Data Reported; -- = Not Applicable; NA = Not Available; W = Withheld to avoid disclosure of individual company data. |
| Release Date: 8/30/2024 |
| Next Release Date: 9/30/2024 |