|
Download Data (XLS File) |
|
||||||||
|
||||||||
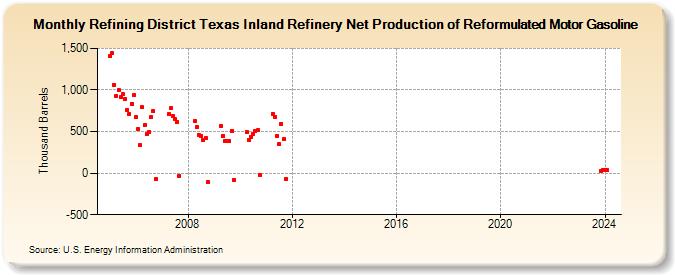
| Refining District Texas Inland Refinery Net Production of Reformulated Motor Gasoline (Thousand Barrels) | ||||||||
| Year | Jan | Feb | Mar | Apr | May | Jun | Jul | Aug | Sep | Oct | Nov | Dec |
|---|---|---|---|---|---|---|---|---|---|---|---|---|
| 2005 | 1,413 | 1,439 | 1,063 | 928 | 998 | 916 | 951 | 891 | 762 | 714 | 837 | 942 |
| 2006 | 669 | 533 | 338 | 792 | 574 | 465 | 490 | 675 | 745 | -69 | ||
| 2007 | 711 | 779 | 690 | 648 | 617 | -29 | ||||||
| 2008 | 626 | 552 | 454 | 448 | 402 | 417 | -110 | |||||
| 2009 | 563 | 447 | 386 | 391 | 388 | 512 | -81 | |||||
| 2010 | 490 | 403 | 435 | 476 | 509 | 515 | -23 | |||||
| 2011 | 717 | 677 | 444 | 349 | 593 | 407 | -66 | |||||
| 2012 | 549 | 449 | 545 | 513 | 491 | 490 | -25 | |||||
| 2023 | 30 | 38 | ||||||||||
| 2024 | 36 | |||||||||||
| - = No Data Reported; -- = Not Applicable; NA = Not Available; W = Withheld to avoid disclosure of individual company data. |
| Release Date: 3/29/2024 |
| Next Release Date: 4/30/2024 |