|
Download Data (XLS File) |
|
||||||||
|
||||||||
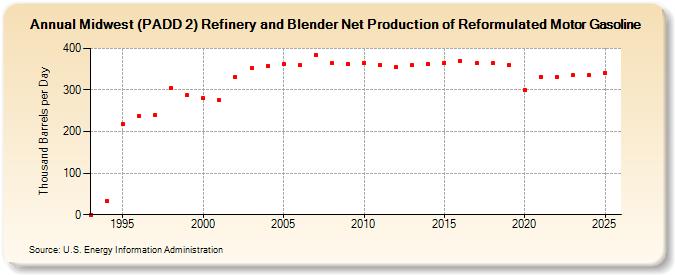
| Midwest (PADD 2) Refinery and Blender Net Production of Reformulated Motor Gasoline (Thousand Barrels per Day) | ||||||||
| Decade | Year-0 | Year-1 | Year-2 | Year-3 | Year-4 | Year-5 | Year-6 | Year-7 | Year-8 | Year-9 |
|---|---|---|---|---|---|---|---|---|---|---|
| 1990's | 0 | 32 | 218 | 238 | 240 | 304 | 287 | |||
| 2000's | 280 | 275 | 331 | 352 | 358 | 362 | 360 | 384 | 364 | 363 |
| 2010's | 366 | 361 | 355 | 359 | 363 | 366 | 370 | 364 | 364 | 359 |
| 2020's | 300 | 332 | 331 | 335 |
| - = No Data Reported; -- = Not Applicable; NA = Not Available; W = Withheld to avoid disclosure of individual company data. |
| Release Date: 8/30/2024 |
| Next Release Date: 8/29/2025 |